Win rate is the number traders quote at dinner: “I’m right seventy percent of the time.” It feels like a scoreboard. It is the single most misleading statistic in trading, because it is silent on the only thing that actually pays — how big your winners are next to your losers. You can be right ninety percent of the time and still go broke, and you can be wrong sixty percent of the time and get rich. This is not a paradox. It is arithmetic that your brain is wired to ignore, and once you see it, you stop asking “how often am I right?” and start asking the only question that matters: what is the average outcome of a trade?
Win Rate Is a Comfort Number
Win rate is just the share of trades that close green — win sixty of a hundred and your win rate is 60%. The problem is what it leaves out. A metric that counts how often you win but ignores how much is not a performance metric; it is a feeling. Picture a strategy that wins 90% of the time by taking $10 profits, but the losing 10% of trades lose $100 each. Over a hundred trades you make 90 × $10 = $900 and lose 10 × $100 = $1,000. A 90% win rate, and you are down $100. Win rate told you a triumphant story about a losing system. Any number that can point the wrong way this cleanly should never sit at the center of how you judge yourself.
Expectancy Is the Real Metric
The number that does not lie is expectancy: the average dollar outcome per trade, and the only figure that compounds in your account. The formula is short:
Expectancy per trade = (Win% × average win) − (Loss% × average loss).
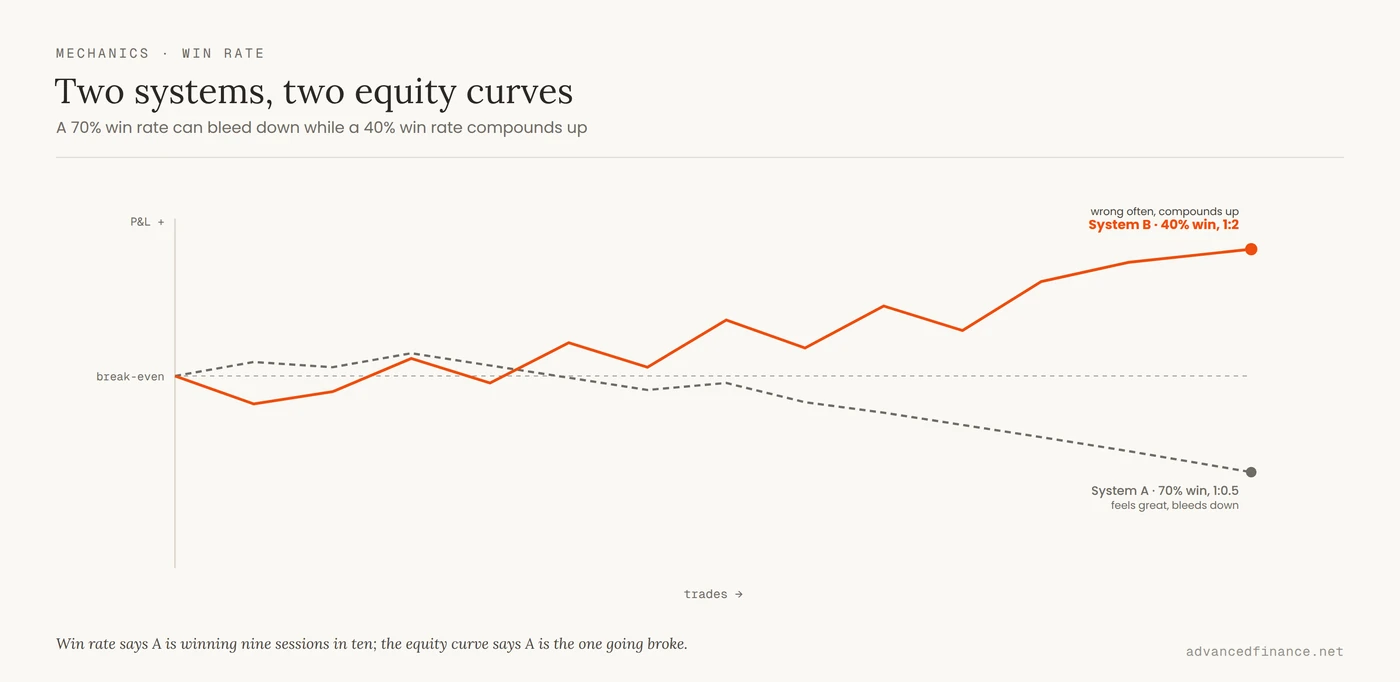
Run two systems through it, risking $100 a trade. System A is the crowd-pleaser — a high win rate built on small targets. System B is the one that feels uncomfortable — often wrong, but its winners dwarf its losers. Expectancy settles the argument instantly:
| System | Win rate | Win / loss size | Expectancy per trade (gross → net) |
|---|---|---|---|
| A — the comfort system | 70% | +$50 / −$100 | +$5 → −$3 |
| B — the robust system | 40% | +$200 / −$100 | +$20 → +$12 |
System A wins nearly twice as often and loses money. System B is wrong most of the time and earns roughly $1,200 over a hundred trades after costs. The trader running System A feels like a winner on almost every session and bleeds out slowly; the trader running System B endures long losing streaks and gets paid. Expectancy is what separates them, and win rate hid it completely. Where that positive average actually comes from — and why any edge decays once others find it — is a separate question, covered in where a trading edge actually comes from. This page is narrower: whatever the source, win rate alone can never tell you whether the edge is there.
The Break-Even Win Rate
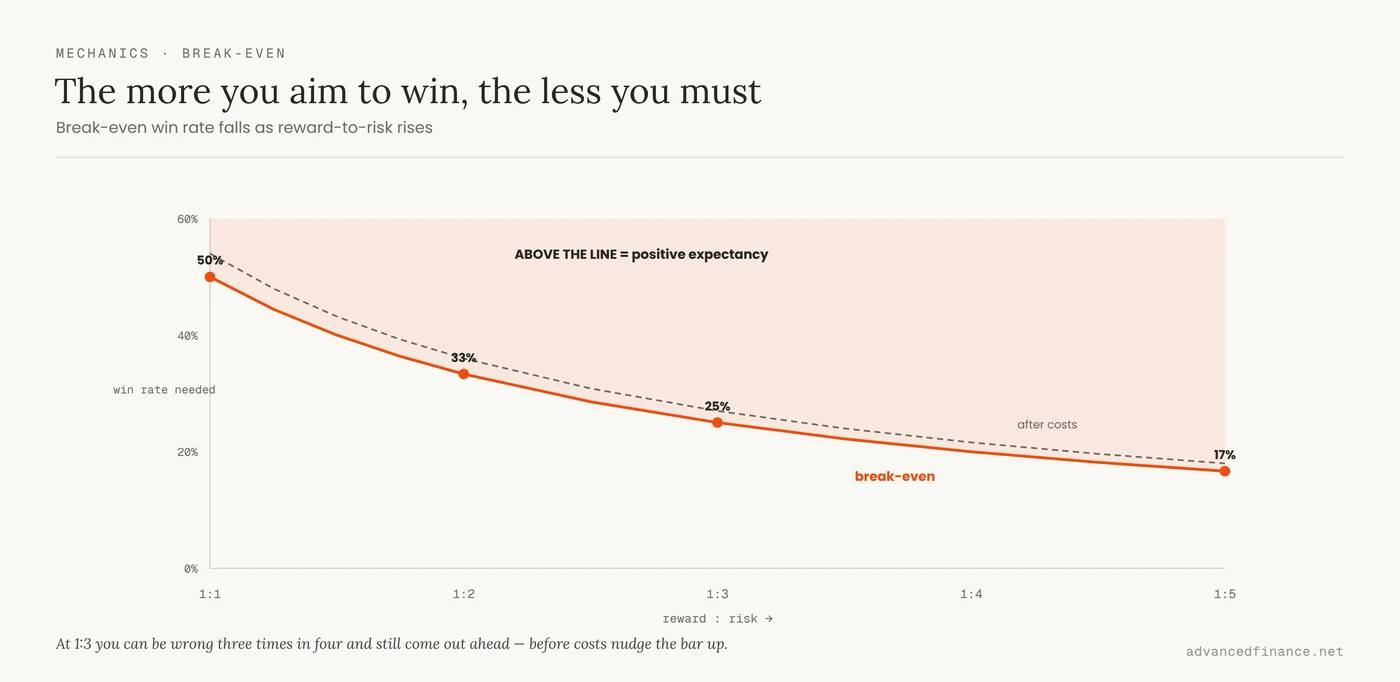
Here is the part that reframes the whole debate. For any reward-to-risk ratio there is a break-even win rate — the hit rate at which you exactly break even — and it is fixed by arithmetic, not opinion. Win a multiple r of what you risk, and you break even when your win rate equals 1 ÷ (1 + r). The higher your reward-to-risk, the lower the win rate you need:
| Reward : risk | Break-even win rate | Break-even after costs |
|---|---|---|
| 1 : 1 | 50% | ~54% |
| 1 : 1.5 | 40% | ~43% |
| 1 : 2 | 33% | ~36% |
| 1 : 3 | 25% | ~27% |
| 1 : 5 | 17% | ~18% |
Two things fall out of this table. First, costs quietly raise the bar you have to clear: at 1:1 you no longer need 50% but about 54%, and the thinner your reward, the more friction moves the line against you. Second, and more important, win rate and reward-to-risk are not independent dials you can both crank to the maximum. Aiming for wider targets means price has to travel further before you are paid, so fewer trades reach the goal and your hit rate falls — that is why a patient 1:3 system naturally wins less often than a scalp. The goal is never to maximize either number alone; it is to find the pair that sits comfortably above its break-even line.
Why the High Win Rate Seduces
If the math is this obvious, why does almost everyone chase win rate anyway? Because your brain is optimizing for feeling right, not for being paid. Two well-documented forces do the damage. The first is loss aversion: in the work that won a Nobel Prize, Kahneman and Tversky showed that people feel losses far more sharply than they enjoy equal gains. So a stream of small, frequent wins feels safe and a few large losses feel catastrophic — exactly the wrong emotional weighting for a game where the large winners are where the money is. The second is the disposition effect: analyzing thousands of real accounts, Terrance Odean found investors systematically sell winners too early and hold losers too long. Cutting winners quickly and letting losers run mechanically raises your win rate while destroying your expectancy — it is the exact opposite of what works. Chasing win rate is not just a spreadsheet error; it is the fear and greed that quietly erase a real edge wearing a respectable disguise.
Costs Invert Small Edges
The break-even table already hinted at the villain that traders discover last: friction. A high-win-rate, low-reward system runs on a razor-thin gross edge, and commissions, the bid-ask spread, and slippage are subtracted from every single trade. In the first table, System A’s +$5 of gross expectancy became −$3 once about $8 of round-trip cost was removed — the friction was bigger than the edge. And friction scales with frequency: a swing trader placing five trades a month pays that cost sixty times a year, while a hyperactive day trader running twenty trades a day pays it thousands of times — so the same thin edge that merely limps for the swing trader is fatal for the day trader. The lower your reward-to-risk and the higher your frequency, the more of your expectancy is eaten, which is precisely how costs turn a winning backtest into a live loser. It is also why the outcomes for active retail traders are so bleak: a study of Brazilian day traders, Chague, De-Losso and Giovannetti’s “Day Trading for a Living?”, found that of those who persisted for more than 300 days, about 97% lost money. Many were “right” often. Being right is not the same as being paid — the whole of why most day traders underperform the market.
How to Measure Expectancy
The fix is unglamorous and mechanical. Keep a trade log that records, for every trade, your entry, your stop, your target, and the actual result in R multiples — the framework the trading psychologist Van Tharp popularized — where 1R is the amount you risked. A trade that made twice your risk is +2R; a full stop-out is −1R. Expressing results in R strips out position size and lets you average cleanly:
| Trade | Risk (1R) | Result | Outcome (R) |
|---|---|---|---|
| #1 | $100 | +$210 | +2.1R |
| #2 | $100 | −$100 | −1.0R |
| #3 | $100 | −$100 | −1.0R |
| #4 | $100 | +$320 | +3.2R |
The four trades above average +0.83R — wrong half the time, yet clearly positive, because the winners are large. Your expectancy is simply that average across your whole log, and any positive number means the system pays over time. One refinement matters more than any other: segment by setup. An overall 48% win rate can hide a breakout setup running at 58% and a fade setup bleeding at 28%; only per-setup expectancy tells you which to keep and which to cut. From there, three rules follow. Set a minimum reward-to-risk and refuse trades below it. Size every position so a single loss risks only a small slice of capital — the discipline behind risk management that keeps you from blowing up the account. And review your trading by expectancy, never by win rate; the moment you catch yourself proud of how often you are right, treat it as a warning light, not a trophy.
FAQ
What is a good win rate for traders?
There isn’t one in isolation — a win rate is only “good” relative to its reward-to-risk. Compare it to the break-even rate: at 1:2 you only need about 33% to profit, so a 40% win rate there beats a 70% win rate at 1:0.5. Always ask for the pair, never the single number.
Can I be profitable with a low win rate?
Yes, and many professionals are. Trend-following systems often win under 40% of the time yet make money, because the occasional large winner more than covers the frequent small losses. What matters is positive expectancy, not the hit rate.
How do I calculate expectancy?
Use (Win% × average win) − (Loss% × average loss) for a dollar figure, or simply average your results in R multiples across your trade log. Any positive result means the edge pays; the larger it is, the faster your account grows.
Why do I keep breaking even with a high win rate?
Almost always because your winners are small relative to your losers and costs finish the job. A thin gross edge gets eaten by commissions, spread, and slippage. Track your R multiples — you will usually find your average win is smaller than your average loss.
Does a high win rate reduce risk?
No. It can actively hide risk, because a long run of small wins masks the few oversized losses that do the real damage. Risk is controlled by position sizing and reward-to-risk, not by how often you are right.
Author’s Insight
I stopped tracking my win rate years ago, and it was the single most useful thing I ever did for my results. For a long time I ran a setup that won about three trades in four, and I loved it — every week felt like a win. It also, I eventually admitted, made almost nothing, because I was banking $40 winners and swallowing $120 losers, and my broker took a cut of each. When I finally logged everything in R and looked at the average, the number was barely above zero and negative after costs. The system I replaced it with wins less than half the time, and some months test my patience badly. But its average trade is solidly positive, and the account curve finally points up. The lesson I keep relearning: my brain will always prefer the strategy that makes me feel right, so I have to let the arithmetic overrule it.
Bottom Line
Win rate is the number that feels good; expectancy is the number that pays. A high hit rate can sit on top of a losing system, and a low one on top of a winning system, because size and costs — not frequency of being right — decide the outcome. Judge every strategy by its average result per trade after friction, pick the win-rate-and-reward pair that clears its break-even line with room to spare, and treat your own craving to be right as a bias to manage rather than a plan to follow. Count the dollars per trade, not the checkmarks.