Most traders do not lose because they cannot predict the market. They lose because they never had a real edge to begin with — and the few who do have one rarely understand where it comes from or how quickly it disappears. This guide breaks down what a trading edge actually is, the four places it can come from, why most apparent edges are statistical illusions, and how to tell whether the money you are making is skill or simply a market regime that has not turned on you yet.
What An Edge Actually Is
An edge is not a prediction. It is positive expectancy that survives real-world costs.
Expectancy is the average result per dollar risked: (Win Rate × Average Win) − (Loss Rate × Average Loss). If that number is positive after commissions, spread, slippage, and financing, you have an edge. If it is negative, no amount of conviction, leverage, or discipline will save you. You are simply funding the other side of the trade at a slower or faster pace.
This is why win rate on its own tells you almost nothing. A system that wins 40% of the time can be highly profitable, and a system that wins 70% of the time can bleed to death if the losers are large enough. When I started, I chased high win rates because being right felt like proof of skill. It was not. It took a losing year to understand that being right often and making money are two different problems. That relationship is the foundation for everything else here, and it is covered in depth in win rate versus risk-reward.
The Four Sources Of Edge
Every durable edge comes from one of four places. Knowing which one you are actually exploiting — and whether you can realistically access it — is the difference between a strategy and a hope.
| Source of Edge | What It Is | Who Realistically Has It |
|---|---|---|
| Informational | Knowing something the market has not priced yet | Institutions, alternative-data desks |
| Analytical | Processing the same public information better or faster | Quants and disciplined retail traders |
| Behavioral | Exploiting other participants' predictable mistakes | Patient retail traders |
| Structural | Speed, queue position, lower fees, direct market access | HFT and prop desks only |
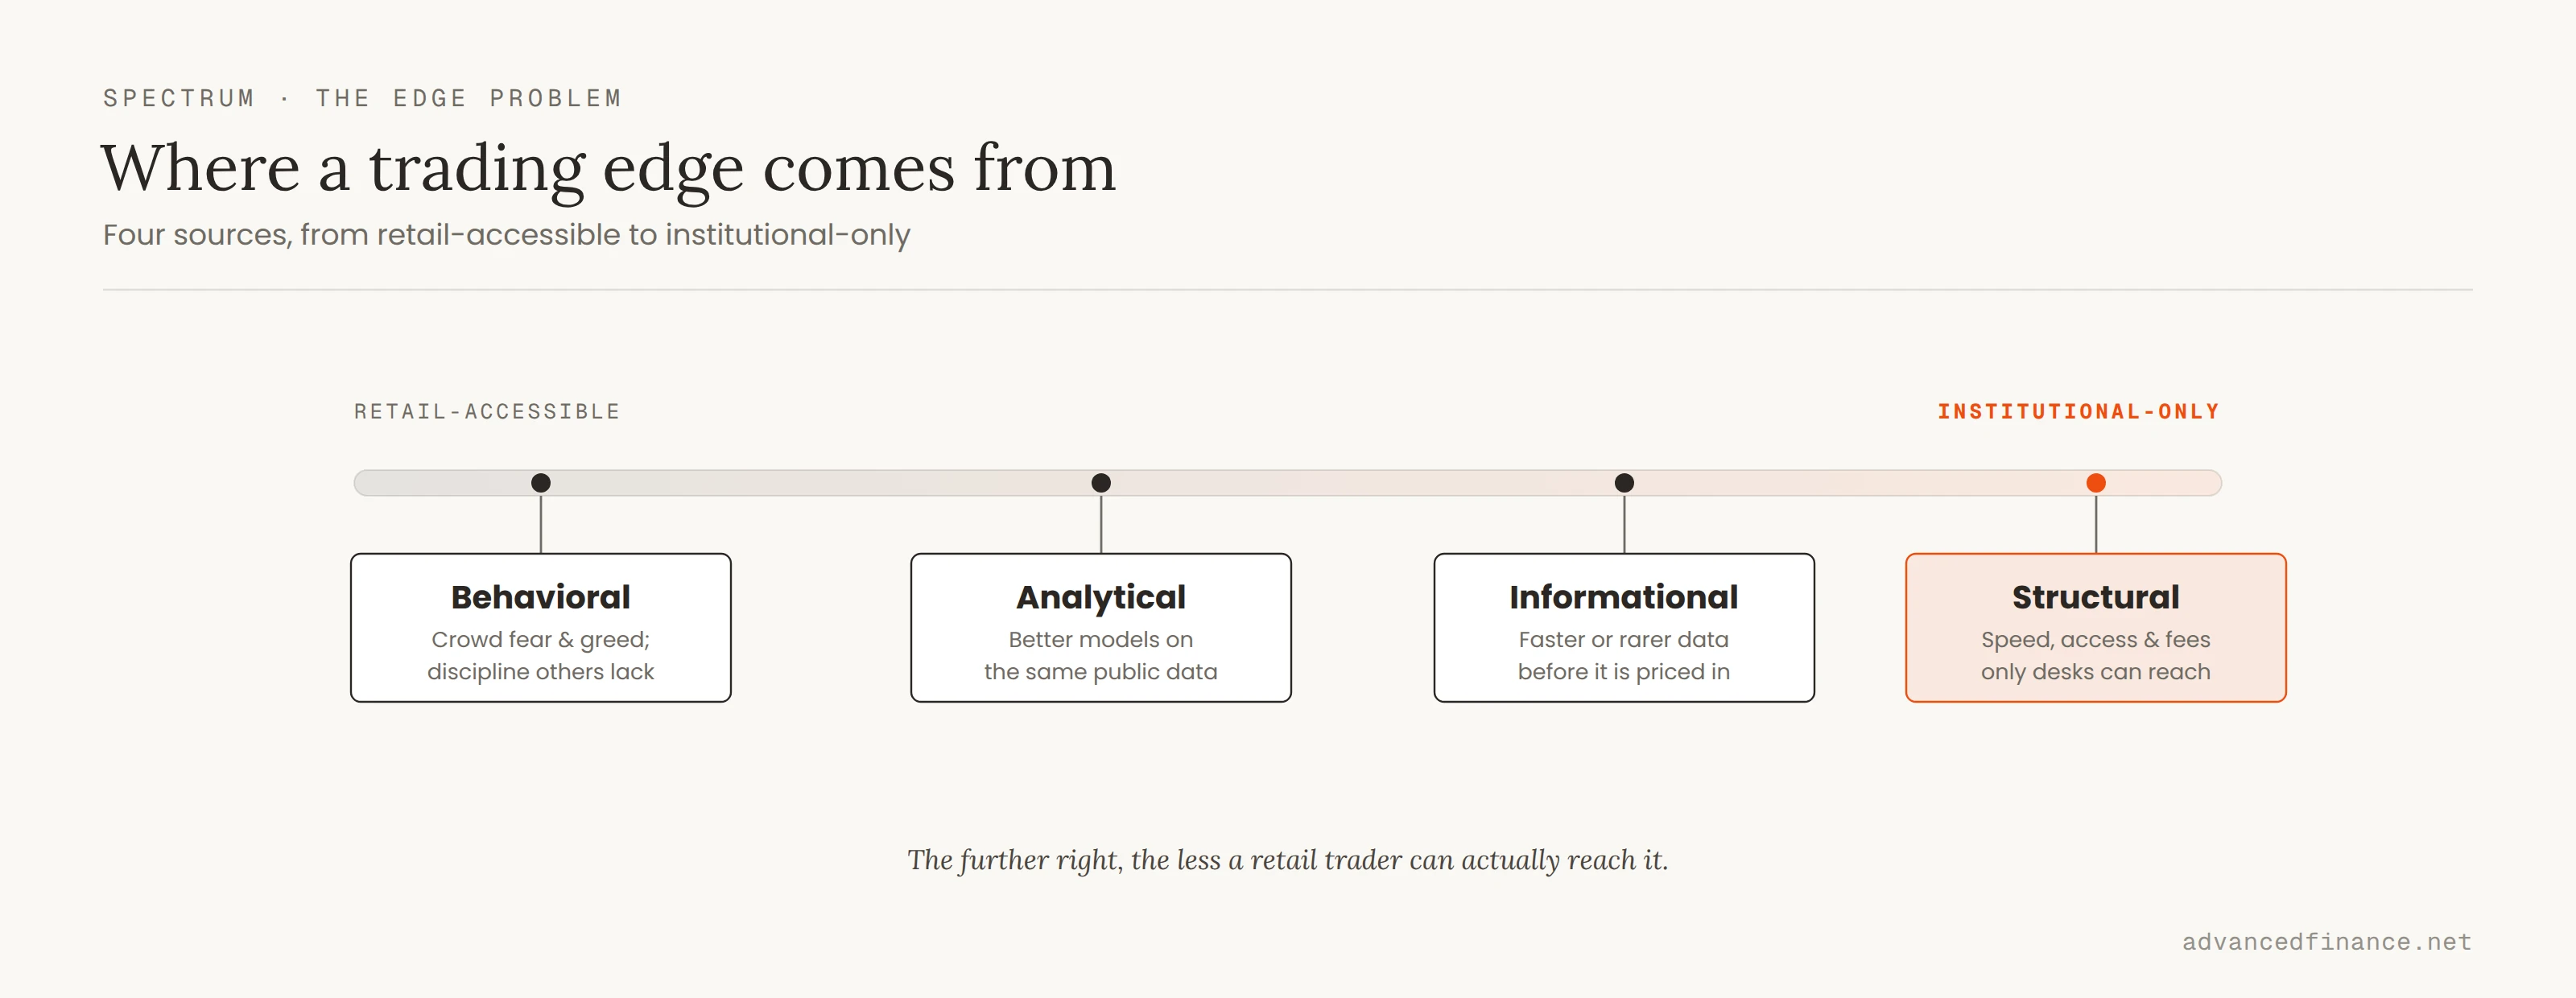
The practical takeaway is uncomfortable for most retail traders: you realistically compete on the behavioral and analytical edges, not the informational or structural ones. If your strategy depends on reacting faster than professional market makers or trading on information before it is public, you are not the competitor. You are the liquidity. The informational and analytical frontier increasingly runs on big data and machine-driven research, and understanding what those desks can do is useful even when you cannot afford the same feeds — because it tells you which games not to play.
Behavioral edge is the one most available to a patient individual. Markets are full of forced sellers, panic exits, stop hunts, and traders chasing yesterday's move. Being on the other side of a predictable, repeated mistake is a real edge — but only if you can define the setup precisely enough to act mechanically. That is why structured signal work matters more than intuition, and it is the subject of high-probability trade setups.
Here is what a behavioral edge looks like in practice. Retail traders tend to place protective stop-losses in the same obvious spot — just below a visible support level — so a pool of forced sell orders builds up in a predictable place. Price gets pushed through that level, the stops fire as market sell orders, and the flush frequently reverses once the forced selling is exhausted. A trader who waits for that flush and buys the reclaim of the level is not predicting anything; they are systematically taking the other side of a crowd that all made the same decision in the same place. The same principle underlies the disposition effect — the documented tendency to sell winners too early and hold losers too long — which leaves behind predictable order flow for a patient counterparty. Neither is a guaranteed win. Each is a repeatable human tendency you can define, measure, and trade mechanically, which is exactly what makes it an edge rather than a guess.
Research vs Production Edge
The most expensive mistake in this business is confusing an edge that existed on a chart with an edge you can actually bank.
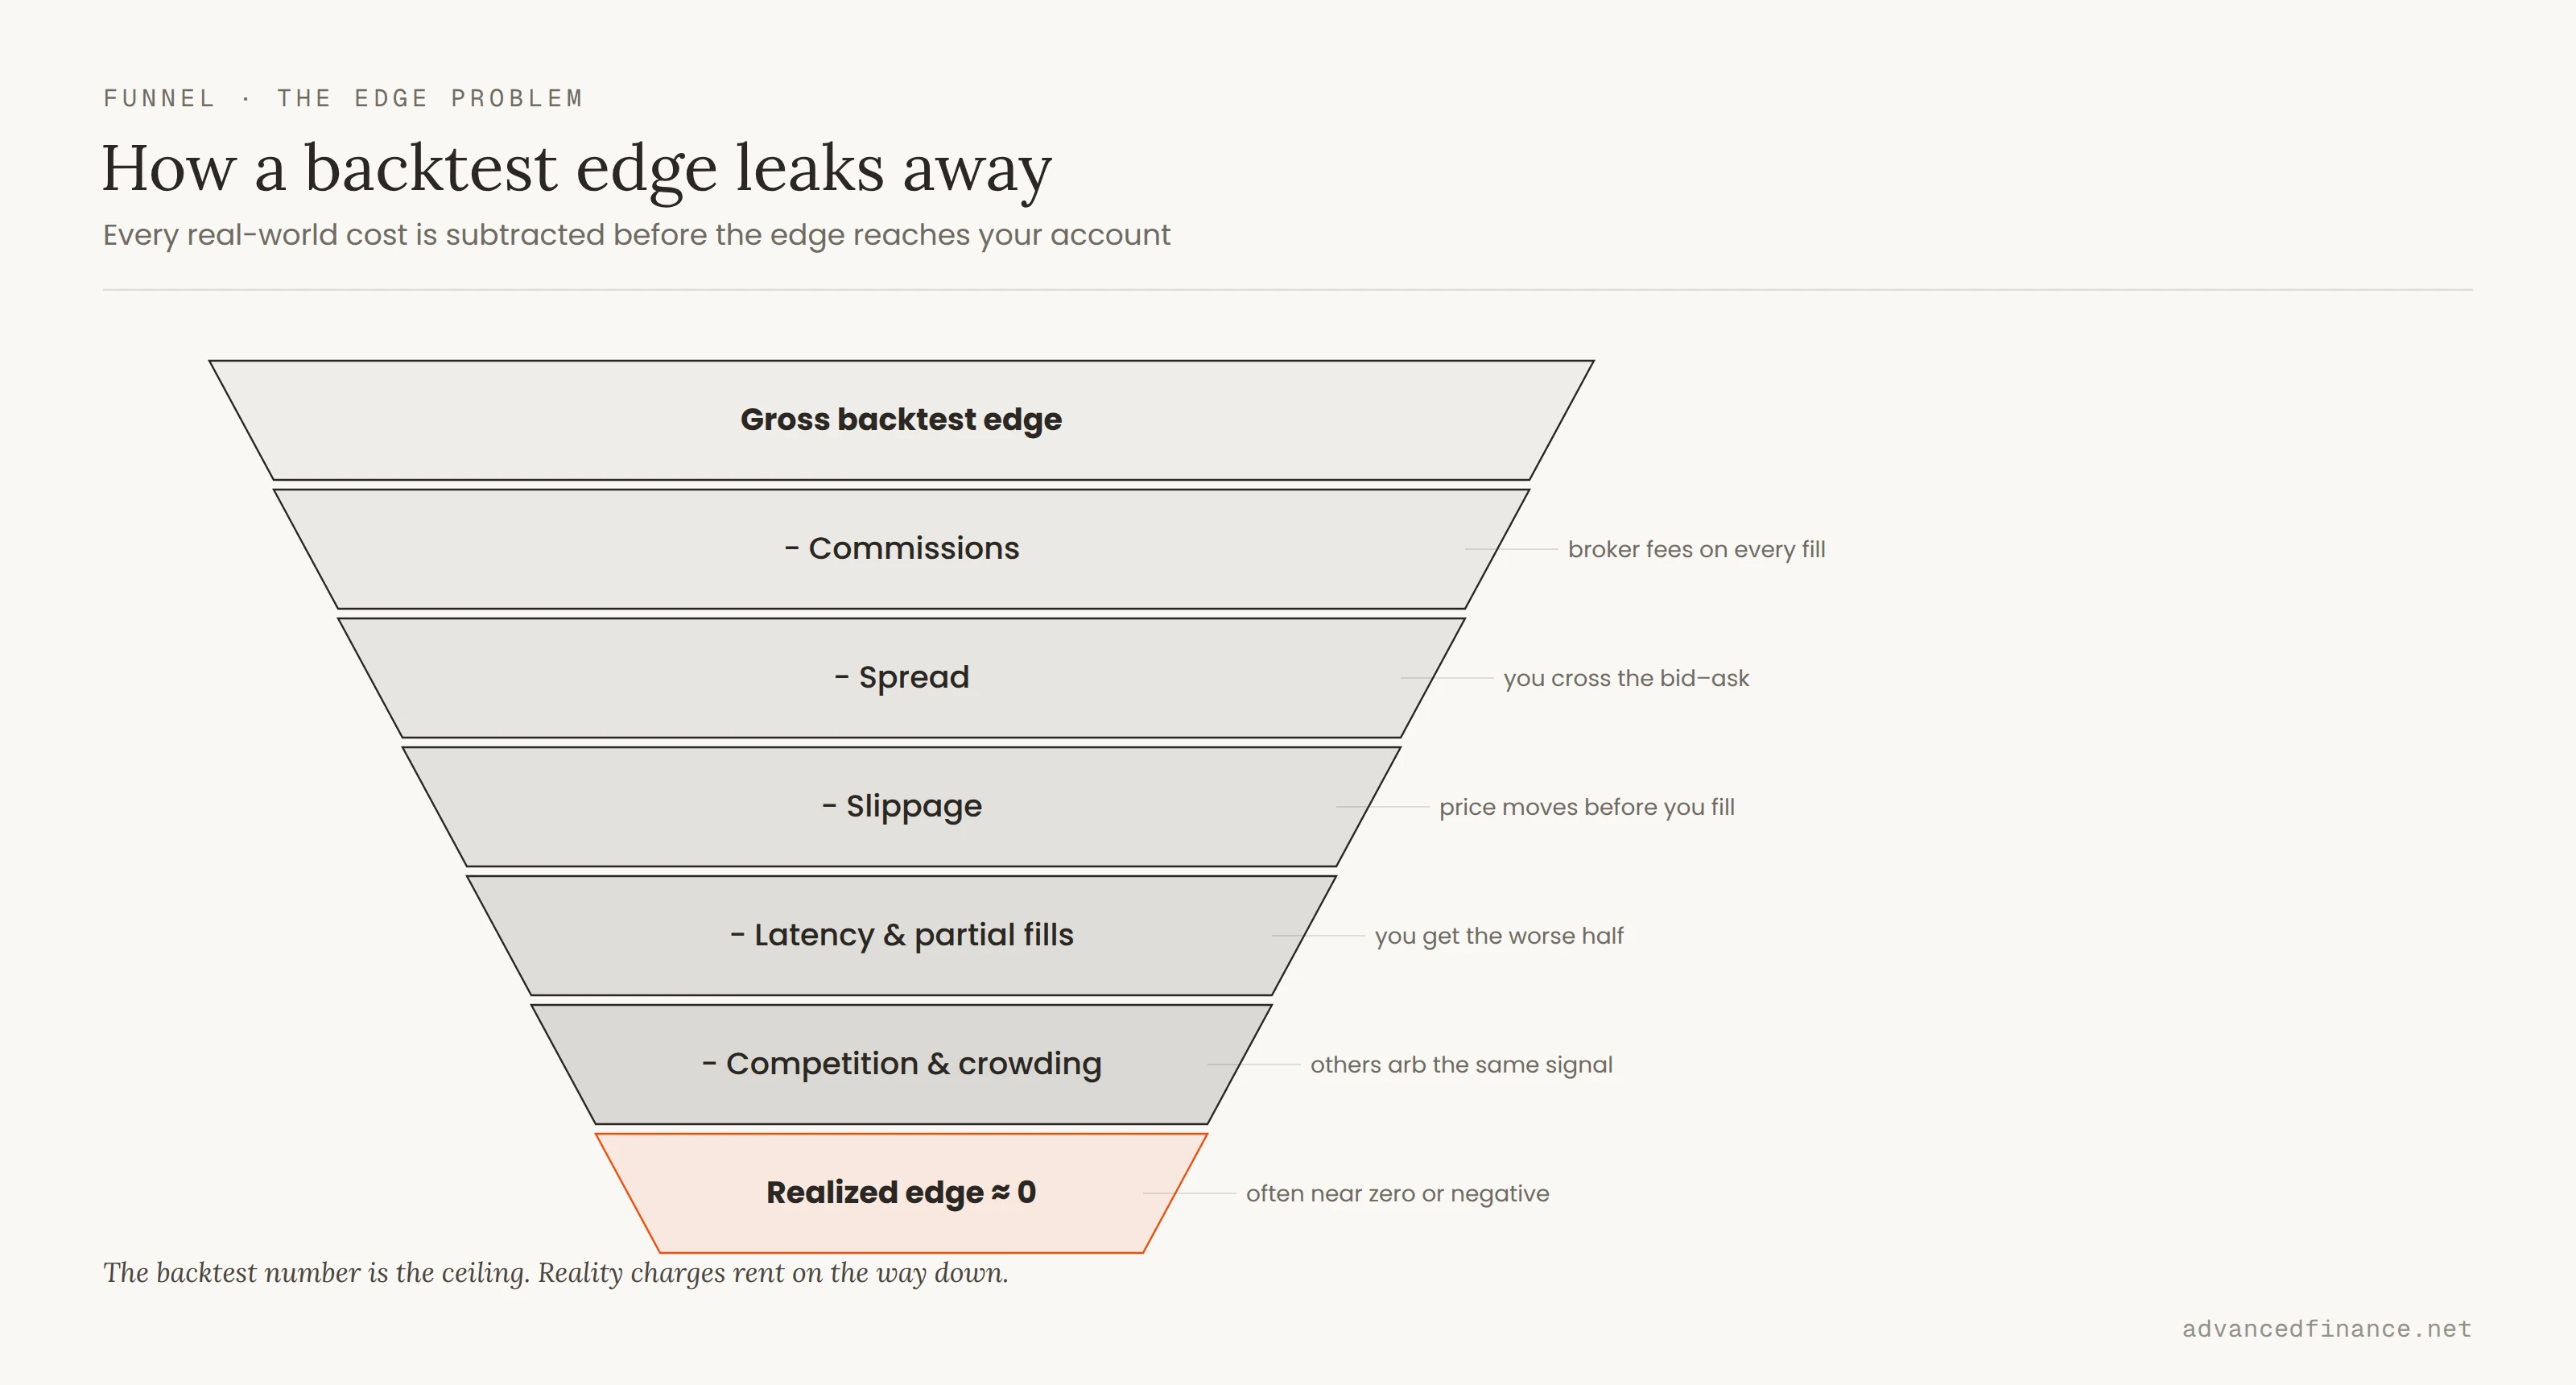
A backtest answers one question: did this work historically? A live account answers a much harder one: can I capture it after fees, latency, partial fills, competitors crowding the same trade, and my own execution errors? Research edge is cheap. Almost anyone can find a curve that looks profitable in a notebook. Production edge is rare, because reality charges rent on every assumption the backtest made for free.
This is the same gap that quietly kills most algorithmic trading systems: a clean equity curve in research, then delayed fills, stale prices, and slippage exactly when the position is largest. Whether you trade by hand or by bot, the discipline is identical — assume the backtest is optimistic until live results prove otherwise, and size accordingly.
Why Most Edges Are Illusions
Most of what traders call an edge is one of four things wearing a costume.
- Overfitting. The strategy was optimized until it memorized historical noise. The warning signs are consistent: too many parameters, profit concentrated in a handful of trades, and results that fall apart when you shift the test window by a few weeks.
- A crowded trade. The edge was real, then everyone found it. When too much capital chases the same signal, the return compresses toward zero and the trade becomes fragile at exactly the moment it feels safest.
- Cost blindness. The edge is real gross, but negative net. Spread, slippage, borrow fees, and funding rates quietly convert a winning system into a losing one, especially at higher trade frequency.
- Luck mistaken for skill. A short winning streak in a favorable regime feels like mastery. Without a large enough sample, you cannot distinguish a genuine edge from a coin that happened to land heads twelve times.
The data on this is brutal. A large study of the Taiwanese market by Barber, Lee, Liu, and Odean found that fewer than 1% of day traders could reliably earn positive returns net of fees. Nor is this confined to exotic markets: Barber and Odean's landmark study of 66,465 US brokerage households from 1991 to 1996 found the most active traders earned just 11.4% a year while the market returned 17.9% — they traded away roughly a third of their potential returns. The common thread is not stupidity. It is people trading systems that never had positive expectancy after costs, then blaming the losses on psychology rather than on arithmetic.
Edge Decay
Even a genuine edge is temporary. This is the part most traders refuse to internalize.
An edge can work and then stop working for reasons that have nothing to do with you. Competitors crowd the trade. Exchange fees or market structure change. Liquidity migrates to another venue. Volatility shifts into a new regime, and a mean-reversion system that thrived in choppy conditions starts fading a strong trend straight into the ground. Institutional desks notice decay quickly because they measure fill quality and live-versus-simulated slippage by venue. Retail traders usually notice only after the equity curve has already rolled over.
This is not a trader's superstition; it is measurable in the academic record. McLean and Pontiff examined 97 published stock-market anomalies and found that a strategy's returns fall by about 58% once it is published, and are already around 26% weaker out-of-sample even before publication. An edge that everyone can read about is an edge that is already being competed away.
For your own strategy, watch for concrete decay signals rather than a gut feeling: a rolling expectancy (say, over your last 50 trades) that trends downward, a live win rate or average win drifting below what the backtest promised, drawdowns that exceed the worst the backtest ever produced, and slippage or fill quality quietly deteriorating. Any one of these on a meaningful sample is a reason to cut size and investigate — not to double down and "wait for it to come back."
The professional response is not to marry a strategy. It is to monitor expectancy continuously and retire an edge the moment it stops paying, rather than defending it because it worked last year.
Do You Actually Have An Edge?
Before risking meaningful capital, run your strategy through this checklist. If it fails any single row, you do not yet have evidence of an edge — you have a hypothesis.
| Test | Question | Pass Condition |
|---|---|---|
| Sample Size | How many trades is the result based on? | Large enough that a few outliers cannot explain the profit |
| Out-of-Sample | Does it work on data it was never tuned on? | Performance holds on untouched, later data |
| After-Cost Expectancy | Is expectancy still positive with realistic fees and slippage? | Positive net, not just gross |
| Regime Stability | Does it survive trending and ranging conditions? | No single market regime accounts for all the gains |
| Survivable Drawdown | Can you take the worst drawdown without blowing up or quitting? | Position sizing keeps the account and the trader intact |
The last row is where most edges die in practice. A positive-expectancy system is worthless if the drawdown forces liquidation or panic before the edge can play out. Surviving long enough to realize your edge is a discipline of its own, and it is the entire subject of risk management and position sizing. Edge and survival are not separate topics. An edge you cannot survive is not an edge.
How To Build An Edge
Auditing an edge is one thing; building one is another. There is no secret indicator, but there is a repeatable process — and it is close to what professional desks actually do.
- Start from a specific market behavior, not an indicator. Name the recurring mistake or asymmetry you intend to exploit — a crowd that stops in the same place, a systematic overreaction to news, a structural flow. An indicator is a tool; the behavior is the edge.
- Define it mechanically. Write the exact market, timeframe, entry condition, and exit so that a rule — or a machine — could execute it with no judgment. If you cannot express it precisely enough to test, you cannot know whether it works.
- Measure expectancy after costs, on data you did not tune it on. In-sample results only tell you the rule fits the past. Reserve untouched, later data and include realistic commissions, spread, and slippage. Positive net expectancy out-of-sample is the first real evidence.
- Forward-test small before you scale. Run it in live conditions at minimal size or on paper. Live friction, emotion, and execution never match the backtest exactly, and this is where fragile edges quietly fail.
- Size for survival, then let the sample grow. Risk little enough per trade that a normal losing streak cannot end you, and give the edge the hundreds of trades it needs to prove itself before committing serious capital.
The point is that an edge is manufactured deliberately — a defined behavior, measured honestly, sized to survive — not discovered by staring at charts until a pattern appears.
FAQ
Is a trading edge the same as a trading strategy?
No. A strategy is the full set of rules you follow — entry, exit, and position sizing. The edge is the specific reason those rules produce positive expectancy: the asymmetry or repeated mistake they exploit. You can have a detailed, disciplined strategy with no edge at all, which is exactly why so many well-organized traders still lose money.
How many trades do I need before I know I have an edge?
There is no universal magic number, because the answer depends on your expectancy and the variance of your returns. A few dozen trades prove nothing — luck dominates at that scale. As a practical floor, many systematic traders want at least 100 trades before taking a result seriously, and often several hundred before trusting it, ideally spread across different market conditions. The stronger and more consistent the edge, the smaller the sample needed to detect it; a thin, marginal edge can require thousands of trades to separate from noise.
Can retail traders have a real edge?
Yes, but usually only a behavioral or analytical one. Retail traders can exploit the predictable mistakes of other participants and can apply more discipline than the average market panic allows. What they generally cannot do is win on speed, information access, or execution cost against firms built specifically for those advantages.
Does AI or automation give me an edge?
Not by itself. Automation removes emotion and enforces rules, which is valuable, but a bot with no positive-expectancy logic simply loses money faster and more consistently than a human would. The edge has to exist before you automate it; automation is an amplifier, not a source.
How do I know when an edge has stopped working?
Track expectancy on a rolling basis rather than looking only at total profit. When your after-cost expectancy drifts toward zero or turns negative over a meaningful recent sample, treat it as decay and reduce or retire the strategy — even if it was excellent a year ago.
Author's Insight
After years of trading, the most important thing I have learned about edge is that it is smaller, rarer, and more perishable than beginners assume. Early on I believed profit came from being clever — better indicators, better predictions, a smarter model. It does not. Profit comes from finding a genuine, measurable asymmetry, sizing it so a bad streak cannot end you, and having the honesty to walk away when the asymmetry is gone. My rule now is simple: I do not need to be right often, and I do not need a strategy that works forever. I need positive expectancy after costs, a sample large enough to trust it, and the discipline to stop the moment the numbers say the edge has left the building.
Trading profits do not come from prediction. They come from positive expectancy that survives real costs, sourced from an edge you can actually access — usually behavioral or analytical for retail, structural or informational for institutions. Most apparent edges are overfitting, crowded trades, cost blindness, or luck in disguise, and even real edges decay as markets adapt. Before risking size, prove your expectancy is positive after costs across a large, out-of-sample, multi-regime sample, and size every position so the worst drawdown leaves both your account and your discipline intact. Find the asymmetry, survive long enough to capture it, and retire it without ego when it fades.