Most guides on swing trading hand you a menu of setups — pullback to the 20-day average, the volatility contraction pattern, the cup-and-handle — as if the setup were the thing that makes money. It isn't. I've watched too many traders collect a folder of perfect chart patterns and still bleed out slowly. The setups are real, and further down I'll give you the exact entry, stop, and target for the three I actually use. But they are not the edge. The edge, and the danger, both live somewhere the tutorials rarely point: in the hours the market is closed.
This piece reframes swing trading around the one fact that actually defines it — you hold overnight — and then builds a repeatable process back out from there: the setups as filters, the sizing math, a weekly routine, and the exit rules. Once you see a swing trade for what it structurally is, the strategy choices get simpler and the risk choices get a lot more honest.
A Swing Trade Is a Held Day Trade
Strip away the jargon and a swing trade is a day trade you refuse to close before the bell. A day trader ends every session flat — whatever the chart does overnight is not their problem. A swing trader deliberately carries the position through the close, for days or a couple of weeks, to capture a structural move that simply cannot complete inside one session.
Why can't it complete in a session? Because the money that actually moves a trend — funds building or unwinding real size — can't enter or exit in a single day without moving the price against themselves. Their accumulation leaves a multi-day footprint, and that footprint is the mid-term trend you are trying to ride. You are not predicting the company. You are following a large, slow participant who is telegraphing their intent one session at a time.
| Style | Typical hold | What you're paid to bear | Overnight gap exposure |
|---|---|---|---|
| Day trade | Minutes to hours, flat by close | Intraday noise, spread, speed | None |
| Swing trade | ~2 to 10 sessions | Overnight gap risk on a trend | High — every held night |
| Position trade | Weeks to months | Trend, drawdown, macro regime | Very high, but diluted by time |
That "what you're paid to bear" column is the whole thesis. It has a price attached, and it is the subject of the next section.
The Gap Is the Real Risk
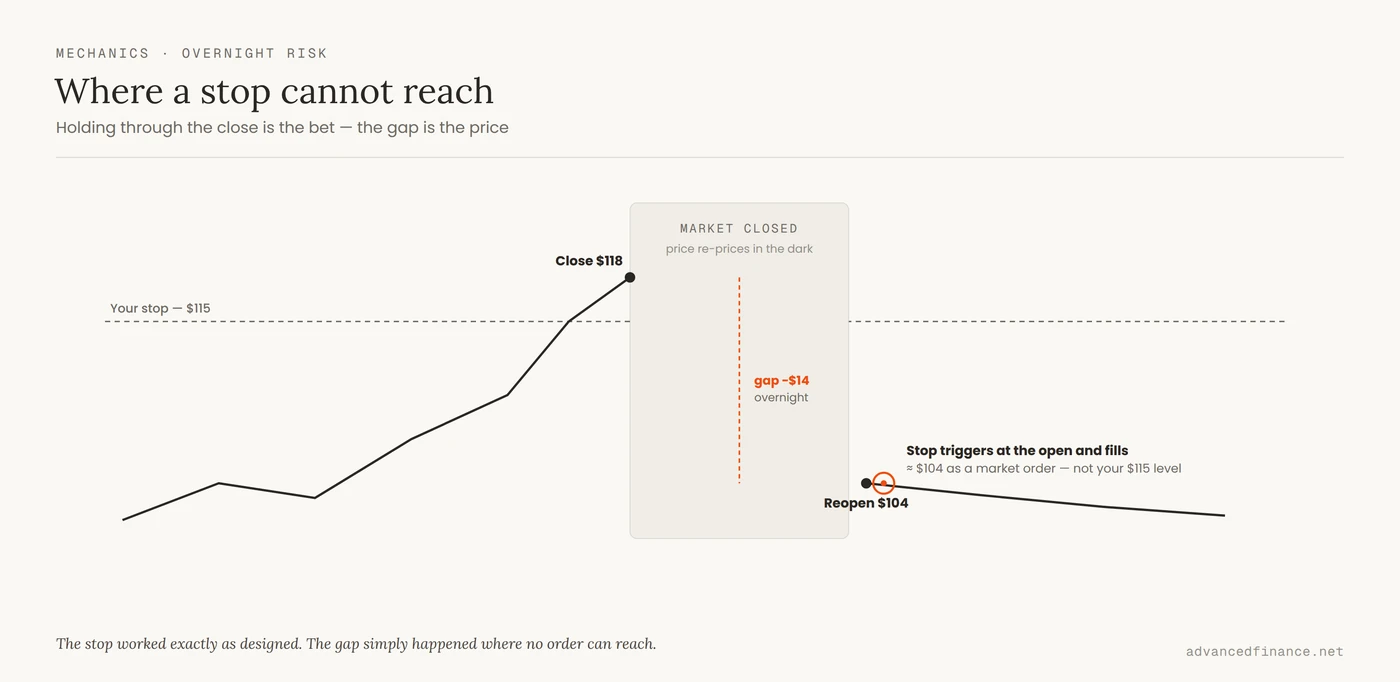
Here is what you are actually being paid for when you hold overnight: gap risk. When the market is closed, price does not pause — it re-prices in the dark and reopens wherever the new information says it should. An earnings release, a geopolitical headline, or a single sentence from a central banker can open a stock far below where it closed. And this is the part beginners underestimate: your stop-loss does not protect you across that gap.
A stop order becomes a market order once your trigger price trades. The U.S. Securities and Exchange Commission is blunt about the consequence: a stop order guarantees no particular execution price, and in fast-moving or gapping markets it can fill far from the level you set (SEC investor bulletin on stop orders). If a stock closes at $118 with your stop at $115 and reopens at $104, you exit near $104, not $115. The stop worked exactly as designed. The gap simply happened where no order can reach.
The good news is that a large share of gap risk is scheduled. You can look up when it will strike. The Federal Reserve publishes its FOMC meeting calendar a year in advance, and the Bureau of Labor Statistics posts its CPI release schedule the same way. Holding a full-size swing position into a known binary event is not analysis; it is a coin flip you volunteered for. The individual company's earnings date belongs on that same list — it is the single most reliable source of a violent gap in any one stock. Later I'll give you a concrete pre-close routine for exactly these events.
So the first real skill of swing trading is not finding entries. It is deciding, for every night you hold, whether the expected move is worth an un-hedgeable gap you cannot stop out of. That decision is what the rest of the craft serves.
Setups Are Filters, Not Edges
Once you accept that overnight risk is the thing you're managing, the setup shrinks to its proper role: it is a filter that improves the odds the next few sessions move your way. It is not a source of profit on its own. Below are the three filters I actually trade, each with an explicit trigger, stop, and target — and, just as important, the specific way each one fails.
| Filter | Entry trigger | Stop → first target | Most common failure |
|---|---|---|---|
| Mean reversion in a trend | Pullback tags the rising 20-day EMA while the 50-day still slopes up | Stop below the swing low; target the prior high (~2× risk) | Buying the pullback while the 50-day is already rolling over — that's a downtrend, not a dip |
| Volatility contraction breakout | Break above the final, tightest contraction on a clear volume surge | Stop below the breakout pivot; target the base's measured move | Chasing a breakout on thin volume — the classic bull trap |
| Relative-strength leadership | Stock holds up while the index sags; buy the first orderly pullback | Stop below the pullback low; trail as it makes new highs | Mistaking a laggard's dead-cat bounce for genuine strength |
Mean reversion inside a trend
Rather than chasing a stock as it prints new highs, you wait for a three-to-five session pullback toward a rising moving average — the 20-day exponential average is a common anchor — while the longer 50-day average still slopes up. You are buying a temporary discount inside an intact uptrend, which is where the reward-to-risk geometry is most in your favor. This is the cleanest way to identify a high-probability trade setup without paying the premium price at the top.
Volatility contraction and breakout
Here you look for a series of pullbacks that each get shallower — a deep correction, then a smaller one, then a tight drift — which signals that eager sellers are finished and supply is drying up. A break out of that final, quiet contraction on a genuine surge in volume marks the moment the balance tips. The key word is volume: a breakout on thin volume is the classic bull trap, price without participation behind it.
Why five indicators aren't five confirmations
Traders love to stack RSI, MACD, Stochastics, CCI, and Williams %R and call it confirmation when they all light up together. They are not five independent witnesses. They are all derived from the same price and volume series, so they mostly say the same thing in different fonts. Treating that as five-fold confirmation manufactures false confidence and over-sized positions. This is exactly why win rate matters less than your reward-to-risk ratio: no cluster of correlated indicators raises your hit rate enough to save a trade whose payoff geometry is upside-down.
Size the Trade to Its Volatility
If the setup is the filter and the gap is the risk, then position sizing is where the money is actually made or lost. The mistake I see most often is a fixed-percentage stop applied to every stock alike. A 2% stop on a sleepy utility and a 2% stop on a high-beta miner are not the same bet — the second one gets tagged by ordinary daily noise before the real move even starts.
The fix is to size against each asset's own volatility rather than a flat dollar figure. The Average True Range (ATR) measures how much a stock typically travels in a session. You set your stop a multiple of ATR away from entry — far enough to sit outside the noise — and then let the number of shares fall out of the math so that hitting the stop costs a fixed, small slice of your account:
Stop distance = ATR × multiple (I use roughly 1.5–2×)
Shares = (Account × Risk %) ÷ Stop distance
Notice what this does: the share count is an output, never a round number you pick first. A jumpy stock automatically gets fewer shares; a calm one gets more; every trade risks the same dollars. The table below runs a $10,000 account risking 1% ($100) through two stocks priced identically at $50 but with very different volatility:
| Stock | ATR stop (1.5×) → shares | Flat 2% stop | What the flat stop does |
|---|---|---|---|
| Calm — ATR $1 | $1.50 stop → ~66 shares | $1.00 | Sits at the noise edge — survives |
| Volatile — ATR $4 | $6.00 stop → ~16 shares | $1.00 | $1 stop sits inside a $4 daily range — noise stops you out early |
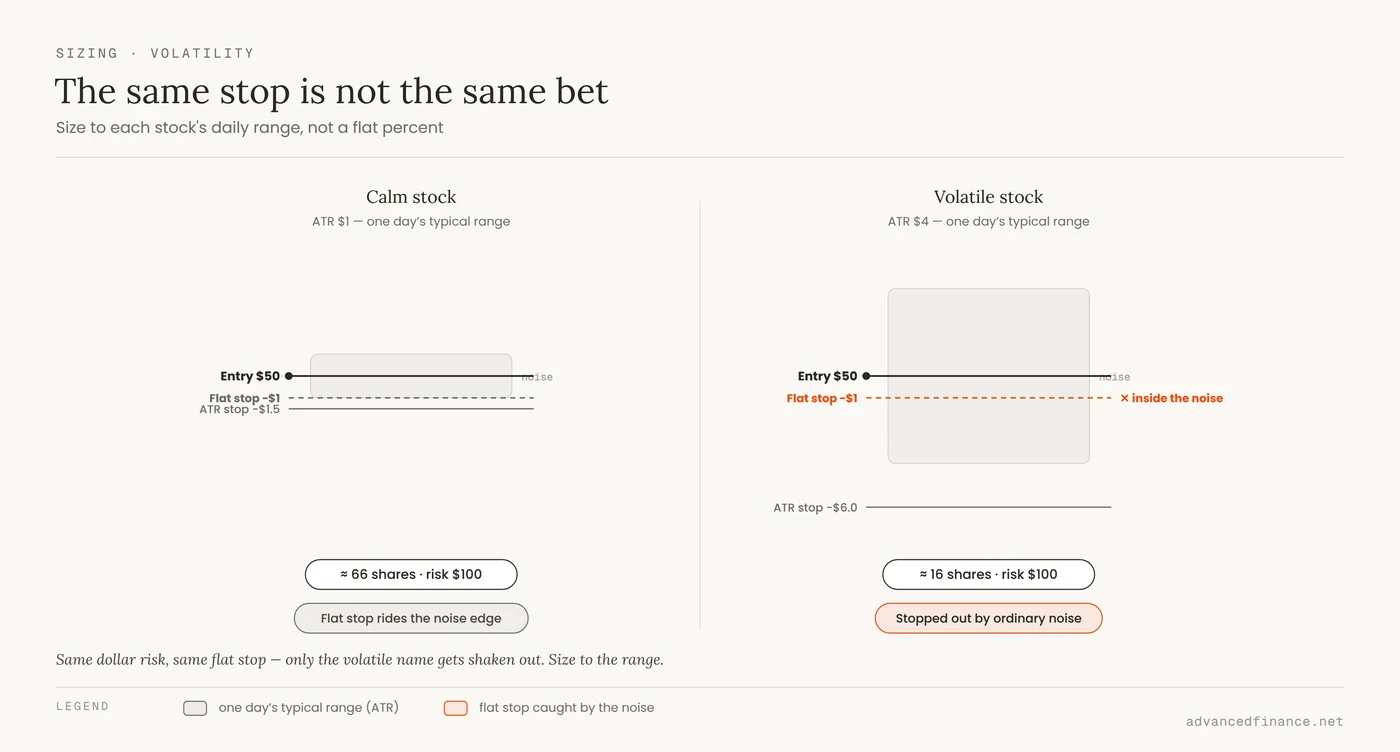
The flat-stop trader buys the same 100 shares of each and gets shaken out of Stock B on a routine wiggle. The ATR-sized trader holds a smaller, survivable position in the volatile name and lets the thesis play out. This is the core of risk management that keeps you from blowing up the account.
One alignment check saves more trades than any indicator. If the broad index is trading below its own long-term average — the market tide is going out — even good long setups tend to stall. Swing trading a long against a falling market is swimming against the current: the setup can be flawless and still go nowhere for lack of an institutional tailwind.
A Repeatable Trading Routine
Framework without process is just an opinion. Here is the actual weekly loop I run — screen, plan, manage, and handle events — so the ideas above turn into repeatable decisions instead of moods.
The weekly screen
- Check the tide first. Is the broad index above or below its 200-day average? Long setups only earn full size when the tide is with them.
- Find the structure. Scan for stocks in clean uptrends that are either pulling back to a rising 20-day EMA or tightening into a volatility contraction.
- Demand liquidity. Keep to names with enough average dollar volume that spreads are tight and your stop can actually fill near its level.
- Require participation. On the trigger, insist on a real volume expansion — price without volume is a suggestion, not a signal.
- Clear the calendar. Note any earnings date, FOMC meeting, or CPI print that falls inside your expected hold, and plan around it before you enter.
Before you click buy
A trade is only allowed on when every line is checked: entry level defined; stop placed beyond ATR noise, not at a round number; first target at least twice the risk; position sized so the stop equals your fixed account percentage; no binary event scheduled inside the planned hold; and the trade aligned with the market tide. If any line fails, it's a pass, not a trade.
Managing the exit
Your exit plan matters more than your entry. I take partial profit at the first target — roughly half the position — which locks in a win and removes the pressure to be perfect. The remainder rides a trailing stop, ratcheted up under each new swing low (or under a short-term average like the 8-day EMA) so a strong trend keeps paying while a broken one takes me out. The one unbreakable rule: never widen a stop. Moving a stop away from price to avoid a loss is how a small, planned loss becomes the trade that wrecks the month.
The pre-close event routine
Roughly thirty minutes before the close, I check the calendar for the next session. If a high-impact release — FOMC, CPI, or a holding's own earnings — lands before the next open, I decide deliberately: trim to a size where a full adverse gap is a scratch, or exit entirely. What I never do is drift into a binary event at full size out of inertia. Holding through the gap should be a choice you can defend, not the default you forgot to question.
The $25,000 Rule Is Changing
For two decades, the standard swing-trading pitch carried a regulatory footnote: because swing traders don't place four or more day trades in five business days, the "pattern day trader" designation and its $25,000 minimum-equity requirement never applied to them in the first place. That part is true. But guides routinely mangle it into "swing trading lets you dodge the $25k rule," as if the rule ever bound you — it didn't, because holding overnight isn't a day trade. What's genuinely changing in 2026 is bigger, and it applies to everyone.
In April 2026, FINRA published Regulatory Notice 26-10, which replaces the old day-trading margin regime — the pattern-day-trader trade count and the fixed $25,000 minimum together — with new intraday margin standards that monitor a customer's intraday margin deficit rather than counting trades (FINRA Regulatory Notice 26-10). The change took effect June 4, 2026, with an 18-month phase-in running to October 20, 2027.
| Old PDT regime (through 2026) | 2026 intraday margin standards (Notice 26-10) | |
|---|---|---|
| What triggers it | 4+ day trades in 5 business days | An intraday margin deficit, monitored during the day |
| Minimum equity | $25,000, flat | No fixed $25k; equity tied to actual intraday exposure |
| What's measured | The count of trades | Real-time or end-of-day margin deficit |
| Repeat-violation penalty | Account restricted to closing trades | 90-day freeze; 15 business days to satisfy a deficit |
| Timeline | In force ~2001–2026 | Effective June 4, 2026; phase-in to Oct 20, 2027 |
The honest read: Notice 26-10 doesn't change how swing trading works. What it removes is one of the reasons traders cited for preferring swing trading over day trading — the $25,000 wall that made frequent day trading expensive to start is being dismantled. During the phase-in, brokers vary in what they enforce, so confirm your own broker's current rule before assuming anything has changed for your account.
While we're retiring stale talking points, here's another: swing trading is often sold as more "tax-efficient" than day trading. It usually isn't. Any position held one year or less produces a short-term capital gain, which the IRS taxes as ordinary income at your regular graduated rate — the same treatment a day trade gets (IRS Topic No. 409, Capital Gains and Losses). A swing trade held nine days and a day trade closed in nine minutes are taxed identically. Swing trading buys you time away from the screen and a shot at bigger moves; it does not buy you a lower tax bracket.
FAQ
What time frame should I actually watch?
The daily chart is where you find and manage the trade. I use the weekly only to make sure I'm not buying straight into a major long-term resistance level. The intraday charts are a trap for swing traders — watching a 5-minute candle on a trade meant to play out over a week is how you talk yourself out of good positions during ordinary noise.
Can I swing trade with a full-time job?
Yes, and honestly it suits a full-time job better than day trading does. The real work — screening, planning entries, setting stops and targets — happens after the close or on weekends. During the day your orders are already resting; you mostly need a few minutes near the close to run the pre-close event check. That "less screen time" property is swing trading's genuine advantage, unlike the tax myth.
How many positions should I hold at once?
Few enough that you can actually track each one's news and structure — for most people that's a handful, not twenty. Concentration lets your winners matter, but it raises single-stock gap risk, so the discipline is to size each position small enough that one bad overnight gap can't dent the account.
Should I hold a swing trade through an earnings report?
As a default, no. Earnings are the most reliable source of a violent overnight gap in a single stock, and no stop order protects you across that gap. If you choose to hold, do it only with a position sized so small that a full adverse gap is an annoyance, not an account event — and treat that as a deliberate gamble, not a setup.
Do I still need $25,000 to swing trade?
Swing trading never triggered the $25,000 pattern-day-trader minimum in the first place — that rule applied to frequent day trades. And FINRA is now replacing that whole framework with intraday margin standards under Regulatory Notice 26-10, phasing in through October 2027. During the transition, brokers vary, so confirm your broker's current requirement rather than trusting any single number you read online.
Author's Insight
The trades that have paid me best over the years are almost always the ones that felt worst to place. Buying a stock breaking to new highs feels safe and is often the moment large holders are handing shares to latecomers. Buying a pullback to a rising average while the financial channels are loudly nervous feels awful and is frequently where the move actually begins. But the feeling isn't the lesson. The lesson is that I decided where I was wrong, and where I'd take profit, before I entered. If you can't name your exit on both sides before you click buy, you're not swing trading — you're holding overnight and hoping. And hope, priced against a gap you can't stop out of, is the most expensive position on the book.
Bottom Line
Swing trading isn't a collection of chart patterns; it's the deliberate choice to carry a trade through the close in exchange for bearing overnight gap risk. Get that framing right and everything downstream falls into place: the setup is only a filter, the gap is the true risk, position size against volatility is where the P&L is decided, a repeatable weekly routine keeps you consistent, and the old regulatory shortcuts are shifting under your feet in 2026. Pick one filter, size every trade so a bad night can't hurt you, respect the scheduled events on the calendar, and know your exit before your entry. The mid-term trend will pay you — but only for the risk you actually chose to take, not the one you forgot you were holding.