You have heard the number. The average investor badly trails the very market they are invested in — by four points a year, by eight in a bad one — because they panic, chase, and self-sabotage. It is one of the most repeated statistics in personal finance, and it is used to sell everything from robo-advisors to expensive hand-holding. It is also, measured honestly, mostly wrong. The real shortfall between what funds earn and what their investors keep is closer to a single percentage point a year — still worth closing, but an order of magnitude smaller than the folklore, and pointing to a completely different cure than the willpower sermons you have been sold. Worse, the fixation on your emotions distracts from two leaks that are larger, more certain, and far easier to plug: what you pay, and what you own.
The 8% Myth
The stat that launched a thousand lectures comes from DALBAR’s annual Quantitative Analysis of Investor Behavior, which reported that in 2024 the average equity fund investor earned 16.54% while the S&P 500 returned 25.02% — a gap of 8.48 percentage points in a single year, which DALBAR called the second-largest of the decade. Stretched over twenty years, its methodology implies a shortfall north of four points annually. The figure gets quoted endlessly as proof that investors are their own worst enemy, and it is seductive precisely because it flatters whoever is telling it and shames whoever is listening into buying help. But before you accept that you are bleeding eight points a year to your own nerves, it is worth looking at how that number is actually built.
Why the Big Number Lies
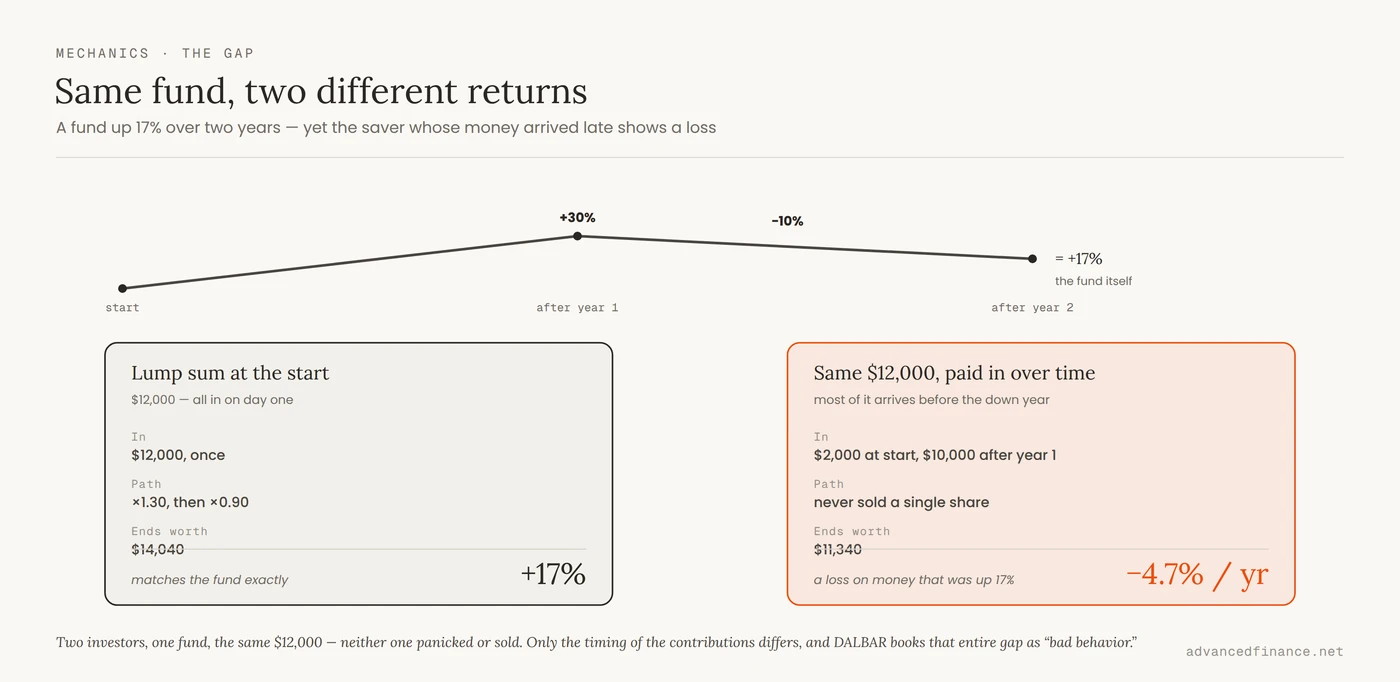
Here is the sleight of hand, laid out clearly by analysts like Michael Kitces: DALBAR compares a dollar-weighted investor return against a time-weighted index return — an apples-to-oranges match. A time-weighted return assumes a lump sum dropped in on day one and left untouched; a dollar-weighted return reflects money that trickles in over decades through paychecks and retirement contributions. Picture a fund that gains 30% one year and loses 10% the next — up 17% over the two years together. An investor who puts a lump sum in at the start and never touches it earns exactly that 17%; her dollar-weighted return and the fund’s time-weighted return are identical. Now picture the realistic saver, whose account is small early and large later: she has only about $2,000 riding the good year but roughly $12,000 riding the bad one. She never panicked and never sold — yet she ends with less than she paid in, and her dollar-weighted return is negative against a fund that rose 17%. Nothing separates the two investors but the timing of their contributions, which is a fact of having a career, not a character flaw. DALBAR’s method books that entire difference as misbehavior, which is why its own data has even shown the average investor slightly beating a disciplined dollar-cost-averaging path — the opposite of what the “irrational investor” story predicts.
What the Gap Really Is
Measure it honestly — dollar-weighted investor returns against dollar-weighted fund returns, apples to apples — and the gap shrinks by an order of magnitude. Morningstar’s annual Mind the Gap study found that over the decade ending December 2023 the average dollar invested in US funds and ETFs earned 6.3% a year while the funds themselves returned 7.3% — a gap of roughly 1.1 points a year, meaning investors kept about 85% of what their own funds produced and left the other 15% on the table; the 2025 update put it near 1.2%. Morningstar itself is careful about what that gap means: even this smaller number reflects when and how investors happen to use funds, not pure irrationality. But small is not nothing. Compounded, that same 1.1-point drag works out to close to a quarter less final wealth over a thirty-year horizon — real money, just an order of magnitude below the folklore, and pointed at a different fix.
| Source | What it compares | Reported gap | What it really shows |
|---|---|---|---|
| DALBAR QAIB | Dollar-weighted investor vs time-weighted index | ~4–8+ pts / year | Mixes real behavior with a sequence-of-returns artifact |
| Morningstar Mind the Gap | Dollar-weighted investor vs dollar-weighted fund | ~1.1 pts / year | The honest gap — and even this is more timing than character |
The Leak That’s Actually Bigger
Keep the timing gap in one hand, because there is a separate leak in the other that is both larger and more certain — and it has nothing to do with your nerves. It is what you own. The single most expensive decision most investors make is holding actively managed funds that lose to the index they are trying to beat, a drag baked into the fund’s own return before your timing enters the picture at all. S&P’s SPIVA scorecard is relentless on this: 65% of active US large-cap funds trailed the S&P 500 in 2024, and over the fifteen years ending that December, not one fund category had a majority of its active managers beat their benchmark. That is not a behavior gap you can coach away; it is structural, it compounds every year regardless of how calm you stay, and it dwarfs the occasional cost of a panic. Add the quiet erosion of tax drag — the tax you owe each year on fund distributions you never chose to trigger — and you have two leaks that are bigger, more predictable, and far easier to seal than your own psychology.
Where the Gap Comes From
The honest one-point timing gap that remains does come from behavior, but not the cartoon version of it, and Morningstar’s own data shows exactly where it hides. The gap is not spread evenly — it tracks how volatile a fund is far more tightly than how much it charges. In the decade to 2023 the gap was widest in sector and thematic equity funds, at about 2.6 points a year, and nearly invisible in plain allocation funds, at roughly 0.4 — the boring, broadly balanced holdings that give you almost nothing to jump in and out of. Even the split between index and active funds fits: broad index funds lost about 0.8 points to timing versus 1.2 for active ones. The lesson writes itself. The more volatile and narrowly focused a holding, the more of its return investors leave behind chasing it — which is also why the average is not the whole story. In genuinely jumpy, concentrated bets — a single hot stock, a thematic ETF, a crypto token — real investors do buy high and sell low, and there the DALBAR-sized gap is closer to true. The critique deflates the headline average; it does not claim behavior never costs anyone. It just means the cure is to own things boring enough that there is nothing to react to.
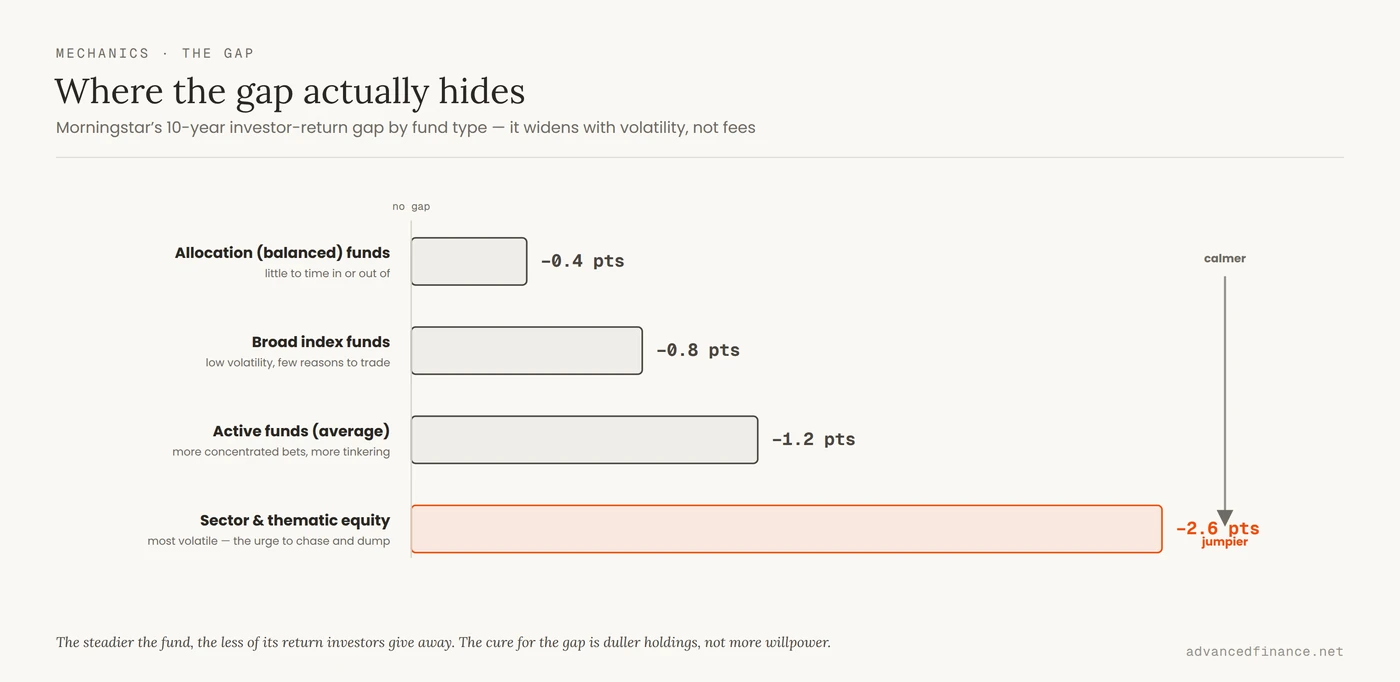
| Fund type | Investor gap / year | Why the gap is that size |
|---|---|---|
| Allocation (balanced) funds | ~ −0.4 pts | Steady, diversified — little to time in or out of |
| Broad index funds | ~ −0.8 pts | Low volatility, few reasons to trade |
| Active funds (average) | ~ −1.2 pts | More concentrated bets invite more tinkering |
| Sector & thematic equity | ~ −2.6 pts | Most volatile — the strongest urge to chase and dump |
How to Keep Your Own Return
So the fix is not a willpower sermon; it is a structure that removes the decisions before you can make them. Own broad, low-volatility index funds, and you close two leaks at once — the SPIVA drag that sinks active investors, and the timing gap that, as Morningstar shows, is driven by volatility rather than by the expense ratio. Automate your contributions, so money is invested on a schedule you never have to feel or approve. The rest is plumbing you set once and stop touching: trade only when an allocation drifts past a set band, not on a hunch, and keep each holding in the account where the tax code touches it least, so the second leak shrinks too. And then — the hardest and most valuable part — do almost nothing, holding an allocation whose worst year you could genuinely sit through. None of this asks you to be unusually calm or clever. It asks you to build a system boring enough that there is nothing left to react to.
FAQ
Is it true the average investor underperforms by 8%?
Not as it is usually told. That figure comes from DALBAR and compares dollar-weighted investor returns against time-weighted index returns, so it folds in a sequence-of-returns effect that has nothing to do with behavior. Measured consistently, as in Morningstar’s Mind the Gap study, the gap is closer to one point a year.
What are dollar-weighted and time-weighted returns?
A time-weighted return measures the fund itself, as if one sum were invested and left alone. A dollar-weighted return measures the investor, accounting for money added and removed over time. Because most people invest more as they age, a market that runs hot early and cools late can drag a dollar-weighted return well below the fund’s time-weighted one, even with zero mistakes — which is precisely the gap DALBAR mislabels.
Where is the behavior gap actually largest?
In the most volatile, narrowly focused holdings. Morningstar found the gap ran about 2.6 points a year in sector and thematic equity funds but only around 0.4 in steady allocation funds. Concentrated, jumpy positions — single stocks, thematic ETFs, crypto — are where investors genuinely buy high and sell low; broad, calm funds barely have a gap at all.
Do index funds really beat active funds on more than fees?
Yes, on two fronts. SPIVA found 65% of active large-cap funds trailed the S&P 500 in 2024, a structural drag; and separately, Morningstar found index-fund investors lost about 0.8 points a year to timing versus 1.2 for active-fund investors. Owning the index closes the larger structural leak and narrows the behavioral one.
When is the DALBAR critique wrong?
When a portfolio really is concentrated and volatile. The critique deflates the claim that the average investor loses eight points to emotion; it does not claim behavior never costs anyone. If you trade single names, thematic funds, or crypto, your personal gap can approach the scary figure — which is an argument for owning calmer things, not for ignoring behavior entirely.
Author’s Insight
Over fifteen years of managing money, the most freeing thing I learned was that I had never really been losing to the market because I was weak. When I stopped defending against the mythical eight-point gap and actually read my own statements, the leaks were embarrassingly boring: a couple of expensive funds that quietly trailed their index, some tax I did not need to owe, and a standing habit of “improving” a portfolio that was already fine. What finally shrank my own gap was not more discipline but duller holdings — once the volatile, tinker-inviting positions were gone, there was simply less to get wrong. The investors I have watched do best are not stoics with iron nerves. They built a system with nothing left to touch, and then went and lived their lives.
Bottom Line
The story that you are hemorrhaging eight points a year to your own emotions is mostly a measurement artifact, repeated because shame sells. The honest gap is about a point a year — real, worth closing, but an order of magnitude smaller and aimed at a different cure. The larger, surer leaks are structural: the active funds that lose to the index, and the tax you never had to owe. Seal those with cheap, broad index funds, automation, threshold rebalancing, and deliberate asset location, then hold an allocation calm enough that you can actually live through its worst year. Do that, and the gap between what your funds earn and what you keep closes quietly, without you having to become a different person to make it happen.