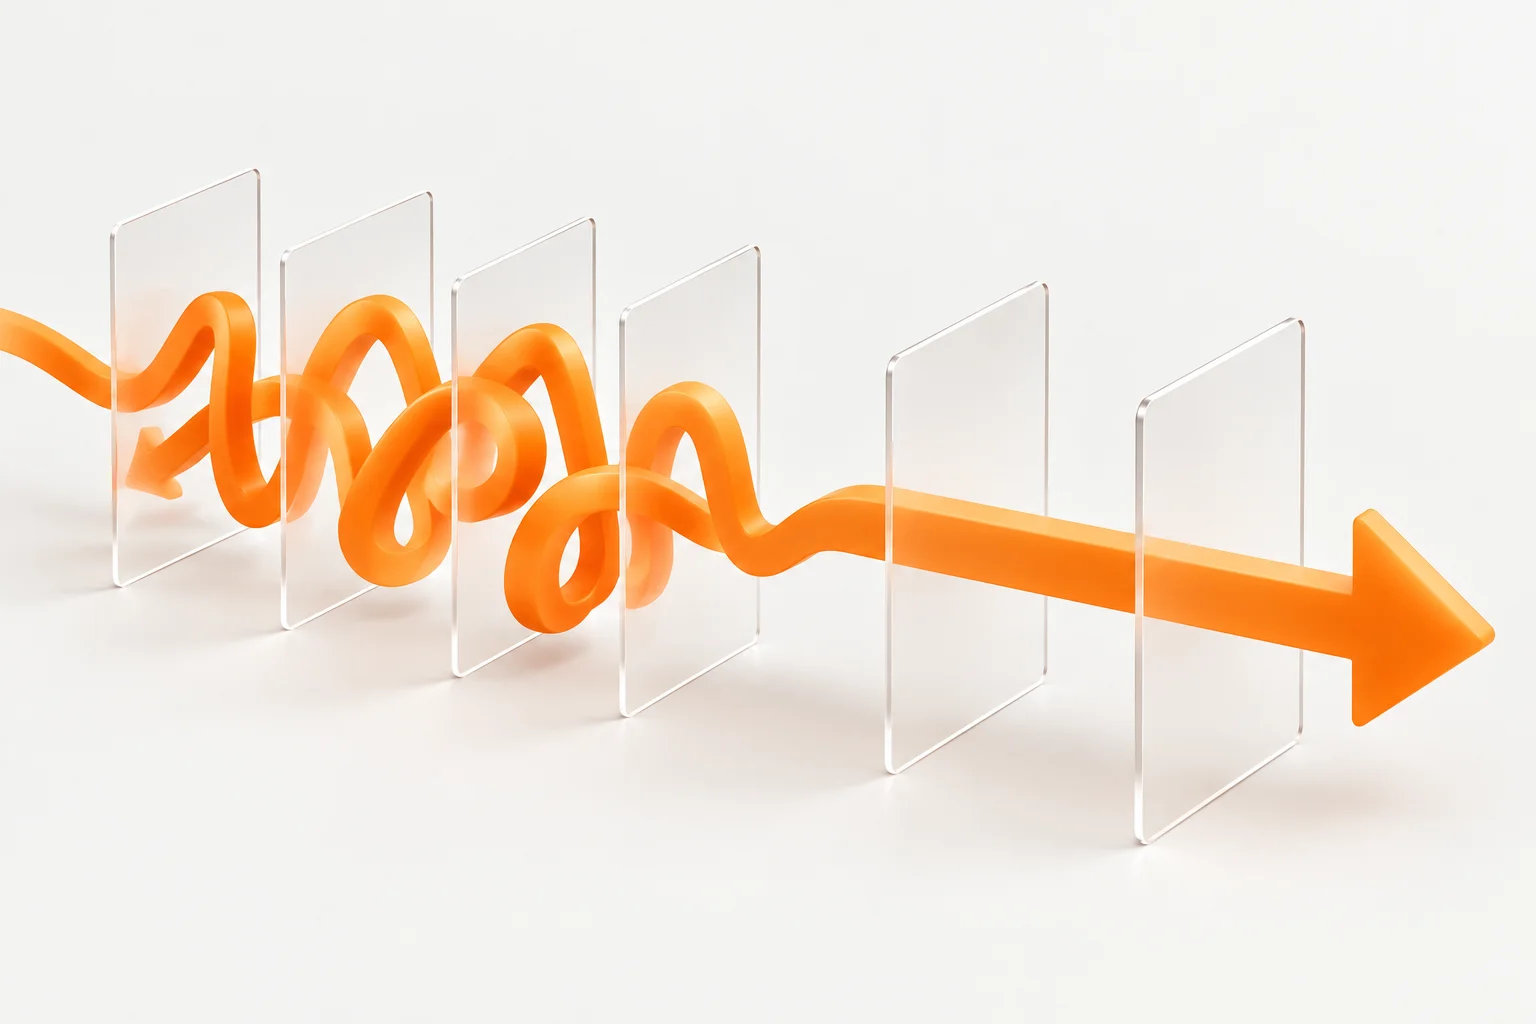
For a diversified portfolio, extra activity buys surprisingly little. Vanguard's test of US stock and bond data from 1926 to 2009 found that rebalancing a 60/40 portfolio monthly rather than once a year barely changed its return or volatility, while multiplying the number of rebalancing events. Each extra change can carry a spread, a tax bill that would otherwise have been deferred, a wash-sale complication or days out of the market. Doing less stops being the better choice when the mix drifts past a limit set in advance, when goals or the horizon change, or when a tax rule, a required withdrawal or a cheaper fund gives a concrete reason to act.
Key takeaways
- In Vanguard's 1926–2009 test, monthly rebalancing (1,008 events) and annual checks with a 5% threshold (28 events) returned 8.5% and 8.6% a year, with volatility of 12.1% and 11.8%.
- A rerun on 1928–2025 annual data shows the same pattern: yearly rebalancing and a 5-point band ended about 3% apart, but the band traded in 35 years instead of 98. Never rebalancing drifted to an average of 86% stocks, with volatility of 15.8% instead of about 12%.
- In a taxable account, realizing a 7% gain every year instead of once after 20 years left $26,222 less on $100,000 at a 15% rate, and $61,944 less at a 24% short-term rate (illustrative example); gains that fall in the 0% bracket reverse that logic.
What more frequent tweaks buy
Rebalancing means trading back to a target mix after markets have pushed a portfolio away; Vanguard's researchers define its purpose as keeping risk close to the chosen allocation, not raising returns. Their 2010 paper by Colleen Jaconetti, Francis Kinniry and Yan Zilbering, reprinted in the AAII Journal in May 2011, tested a 60% stock, 40% bond portfolio from 1926 through 2009 with no taxes, contributions or withdrawals.
| Rule (Vanguard, 1926–2009) | Rebalancing events | Annual turnover | Average annualized return | Volatility | Average stock share |
|---|---|---|---|---|---|
| Monthly, any drift | 1,008 | 2.7% | 8.5% | 12.1% | 60.1% |
| Monthly check, 5% threshold | 58 | 1.7% | 8.6% | 12.2% | 61.2% |
| Annual check, 5% threshold | 28 | 1.6% | 8.6% | 11.8% | 60.7% |
| Annual check, 10% threshold | 15 | 1.4% | 8.7% | 12.1% | 63.0% |
| Never | 0 | 0.0% | 9.1% | 14.4% | 84.1% |
The authors found no optimal frequency or threshold. For most broadly diversified stock and bond fund portfolios, they judged annual or semiannual monitoring with rebalancing at 5% thresholds a reasonable balance between risk control and cost, with annual rebalancing likely preferred when taxes or substantial time and costs are involved. The conclusion assumes historical return patterns roughly persist and holdings are liquid and diversified; concentrated or aggressive portfolios may need more frequent rebalancing to hold risk at the same level.
Later Vanguard work agrees. A January 2026 Vanguard summary of its 2022 "Rational rebalancing" research describes the best methods as neither too frequent, such as monthly or quarterly, nor too infrequent, such as every two years, and notes that transaction costs tend to rise in volatile markets. The SEC's Investor.gov asset allocation page describes calendar and threshold approaches and says rebalancing tends to work best when done relatively infrequently.
One common kind of change runs the other way: buying what has just done well. Sirri and Tufano's study of equity fund flows in the Journal of Finance (1998) found investors put disproportionately more money into funds that had performed very well. Rebalancing does the opposite.
A 98-year test of three rules
To check the pattern on other data, the 60/40 test was rerun on Aswath Damodaran's annual US return data: S&P 500 total returns including dividends and 10-year Treasury bond returns, 1928–2025. Three rules were compared, each starting with $10,000 and ignoring costs and taxes: rebalance every year-end; rebalance at year-end only when stocks are more than 5 percentage points from 60%; and never rebalance. Annual data cannot test a monthly rule.
stock share  w = S / (S + B)
band rule:   rebalance at year-end only if |w - 0.60| > 0.05

S = value of the stock holding, B = value of the bond holding,
both measured after that year's returns
| Window and rule | Rebalances | Ending value of $10,000 | Annual growth | Volatility of annual returns | Average stock share |
|---|---|---|---|---|---|
| 1928–2025, every year | 98 | $25.71 million | 8.34% | 12.1% | 61.1% |
| 1928–2025, 5-point band | 35 | $26.49 million | 8.37% | 12.2% | 62.0% |
| 1928–2025, never | 0 | $69.73 million | 9.45% | 15.8% | 86.1% |
| 1976–2025, every year | 50 | $1,187,752 | 10.03% | 10.6% | 61.2% |
| 1976–2025, 5-point band | 16 | $1,243,882 | 10.13% | 10.7% | 62.4% |
| 1976–2025, never | 0 | $1,754,390 | 10.89% | 13.3% | 79.3% |
The two rebalancing rules ended close together: the band was 3.0% ahead over 98 years and 4.7% ahead over 50, with nearly identical volatility, while trading about a third as often. The never-rebalanced portfolio ended far higher because stocks beat bonds over these windows, but it stopped being a 60/40 portfolio.
By the end of 2025 it was 99.6% stocks, after a year-end range of 39.5% to 99.6%. That extra growth came with risk its owner never chose, so "do nothing at all" and "do less" are different policies. Trading costs barely registered: yearly rebalancing moved 4.0% of the portfolio a year on average and the band 2.9%, about 0.004% and 0.003% a year at an assumed 0.10% per dollar moved. These are results from one historical path, not a forecast.
What each extra change costs
Spreads and other trading costs
A commission-free trade still crosses the bid-ask spread, the gap between the prices buyers pay and sellers receive. Some mutual funds also charge a redemption fee when shares are sold back to the fund. Each cost is small per trade but scales with how much is moved and how often.
annual cost drag ≈ (share of portfolio moved per year) × (cost per dollar moved)
Illustrative example. $100,000 growing 6% a year for 20 years reaches $320,714 with no trading. The table assumes each dollar moved costs 0.10%; other costs scale the results roughly in proportion.
| Activity | Yearly drag | Value after 20 years | Cost versus no trading |
|---|---|---|---|
| Move 5% of the portfolio once a year | 0.005% | $320,393 | $321 |
| Move 5% of the portfolio every month | 0.06% | $316,887 | $3,827 |
| Move the whole portfolio once a year | 0.10% | $314,360 | $6,354 |
| Move the whole portfolio every month | 1.2% | $251,916 | $68,797 |
Fund expense ratios compound in the same way, but they are charged whether or not anything is traded.
Taxes and the value of deferral
In a taxable account, selling at a gain makes the tax due now. Under IRS Topic 409, a gain on an asset held more than one year is generally long-term; a gain on one held a year or less is short-term and taxed as ordinary income (inherited and gifted property follow special rules). For 2026, Rev. Proc. 2025-32 (section 4.03) sets these taxable-income limits for long-term gains:
| Filing status (2026) | 0% rate up to | 15% rate up to | 20% rate |
|---|---|---|---|
| Single | $49,450 | $545,500 | Above $545,500 |
| Married filing jointly | $98,900 | $613,700 | Above $613,700 |
| Head of household | $66,200 | $579,600 | Above $579,600 |
| Married filing separately | $49,450 | $306,850 | Above $306,850 |
Short-term gains fall into the ordinary brackets of 10% to 37%; for 2026 the 24% rate starts at taxable income over $105,700 for single filers and $211,400 for joint filers, according to the IRS 2026 inflation-adjustment release. Higher earners may also owe the 3.8% net investment income tax, charged on the lesser of net investment income or the amount by which modified adjusted gross income exceeds $200,000 (single or head of household), $250,000 (joint or qualifying surviving spouse) or $125,000 (married filing separately).
Illustrative example. A $100,000 position in a taxable account rises 7% a year in price for 20 years, with no dividends. Tax rates stay at 2026 levels, with no state tax or net investment income tax.
hold, sell once:     after-tax value = P(1 + r)^n - t × [P(1 + r)^n - P]
sell every year:     after-tax value = P × [1 + r(1 - t)]^n

P = starting amount, r = yearly gain, n = years, t = tax rate on the gain
| Approach | Total tax paid | After-tax value at year 20 | Versus holding |
|---|---|---|---|
| Hold 20 years, sell once at 15% | $43,045 | $343,923 | — |
| Sell and rebuy yearly, each lot held just over a year (15%) | $38,418 | $317,701 | $26,222 less (7.6%) |
| Sell and rebuy within a year, taxed as ordinary income (24%) | $57,467 | $281,979 | $61,944 less (18.0%) |
The yearly seller at 15% pays less tax in total yet ends $26,222 poorer, because holding keeps the unpaid tax invested until the single sale; short-term gains add a higher rate on top. Selling the whole position each year is an upper bound: rebalancing in the 98-year test moved about 3% to 4% of the portfolio a year.
Two conditions shrink or reverse the result. Bunching 20 years of gain ($286,968) into one sale can push income past a threshold: for a single filer with $60,000 of other modified adjusted gross income, the net investment income tax on that sale would be about $5,585, cutting the holder's lead to about $20,637. And when yearly gains fit inside the 0% bracket, realizing them costs nothing now and raises the cost basis, so selling yearly beats a later sale taxed at 15%.
Wash sales
Frequent selling and rebuying can also trip the wash-sale rule. IRS Publication 550 disallows a loss on stock or securities if, within 30 days before or after the sale, the seller buys substantially identical securities, acquires them in a fully taxable trade, acquires a contract or option to buy them, or acquires them for an IRA or Roth IRA. A purchase by a spouse or a controlled corporation counts too.
The disallowed loss is normally added to the basis of the new shares, so it is postponed rather than lost, and the holding period carries over. The exception is the IRA purchase, where the publication does not add the loss to basis. Whether two securities are "substantially identical" depends on the facts; shares of different companies ordinarily are not.
Time out of the market
Moving to cash and back needs two correct decisions. The FRED S&P 500 series holds 10 years of daily closes, without dividends. From October 10, 2016 to October 9, 2026 (2,513 daily returns), $10,000 grew to $36,103, about 13.7% a year in price alone.
- Missing the 10 best days left $18,815 (6.5% a year); missing the 20 best left $13,589.
- Missing the 10 worst days would have produced $70,711.
- Missing both the 10 best and the 10 worst produced $36,851, close to staying invested.
The last line is the caveat. Eight of the 10 best days fell within four trading days of one of the 10 worst, mostly in March and April 2020 and April 2025. Missing only the best days assumes perfectly bad timing, and cash earns no interest here. An exit during turbulence tends to skip both kinds of day; the outcome depends on when the money goes back in.
When doing something is warranted
"Do less" is a default, not a rule against acting. Each of these gives a concrete reason to change something:
- Drift past a band set in advance. Trading back restores the risk level the owner picked. In the 98-year test, the 5-point band triggered in 35 of 98 years, often after large moves such as 1930–31, 1974, 2002 and 2008.
- A change in horizon, goals or circumstances. The SEC's beginners' guide to asset allocation names a changed time horizon as the most common reason to change an allocation, along with changes in risk tolerance, financial situation or the goal itself, not the recent performance of one asset class.
- Required minimum distributions. Per the IRS RMD FAQs, withdrawals generally must start at age 73; the first can wait until April 1 of the following year and later ones are due by December 31. Workplace plan participants can generally delay RMDs from the plan until the year they retire, unless they are 5% owners of the business sponsoring it (traditional, SEP and SIMPLE IRAs get no such delay), and Roth IRAs and designated Roth accounts have no RMDs while the owner is alive. A shortfall may face a 25% excise tax, or 10% if corrected within two years. Taking it from the overweight holding handles two tasks at once.
- Tax-loss harvesting. Selling at a loss can offset realized gains, and Topic 409 allows up to $3,000 of net capital loss a year ($1,500 if married filing separately) against other income, with the excess carried forward, subject to the wash-sale rule above.
- Unintended concentration. A single stock, employer shares or overlapping funds can quietly grow into a large share of the portfolio; Vanguard's paper notes that concentrated portfolios are more volatile and may need more frequent rebalancing.
- A lower-cost replacement. Switching can make sense even after tax. Illustrative example: $100,000 in a fund costing 0.60% a year, with $30,000 of long-term gain, is sold at 15% ($4,500 tax) and moved to a 0.10% fund, with 6% gross returns. On after-tax values if both were sold, the switch is $199 ahead after one year and $4,010 after ten, assuming the gain would otherwise be taxed at the same rate later.
Frequently asked questions
Does rebalancing inside an IRA create a tax bill?
Not at the time of the trade. Publication 590-A says amounts in an IRA, including earnings and gains, generally aren't taxed until distributed, and some distributions aren't taxed at all. That makes an IRA the lower-tax place to trade when a portfolio spans several account types.
Can new contributions rebalance a portfolio without selling?
Often, yes. The SEC's beginners' guide lists three methods: selling overweight holdings to buy underweight ones, buying more of the underweight category, or redirecting ongoing contributions until the mix is back in balance. Vanguard's paper adds withdrawals, dividends, interest and capital gain distributions as cash flows that can be steered the same way.
Does a 5% band mean 5 points or 5% of the target?
The phrase is used both ways, so a written policy should say which. An absolute band of 5 percentage points on a 60% stock target allows 55% to 65%, as in the test above. A relative band of 5% of the target allows only 57% to 63% and triggers trades more often.
Do target-date funds need to be rebalanced by the owner?
Not within the fund: Investor.gov says the fund's adviser handles rebalancing, typically becoming more conservative as the target date nears. Other funds held alongside it still change the overall mix.
How is the one-year holding period counted?
Publication 550 says to begin counting on the day after the purchase and to include the day of sale. Its example: property bought January 31, 2024 and sold January 29, 2025 gives a short-term result, while a sale on February 6, 2025 gives a long-term one. Selling a few days early can move a gain to ordinary income rates.
A one-page maintenance policy
A short written policy turns "do less" into decisions made in advance, while markets are calm. It can cover:
- Target mix and the reason for it (horizon, goal, tolerance for losses).
- Band for each asset class, stated as points or as a share of the target.
- Review dates set on the calendar, not prompted by headlines.
- Order of tools: new contributions, dividends and withdrawals first, then trades inside tax-advantaged accounts, then taxable sales.
- Tax checks before any taxable sale: holding period, expected rate, and any purchase of the same security in the 30 days before or after a loss sale.
- Triggers that justify acting, taken from the list above.
- A log of each change and its reason, to check later whether trades followed the policy.
The Rebalancing Calculator can show the trades needed to return a portfolio to its target mix once current values are entered.
Sources
- Jaconetti, Kinniry and Zilbering, "Best Practices for Portfolio Rebalancing," AAII Journal, May 2011 (Vanguard research, 1926–2009 data)
- Vanguard, "Why, how and when multi-asset investors should rebalance" (January 2026)
- Investor.gov (SEC), Asset Allocation and Diversification
- Investor.gov (SEC), Beginners' Guide to Asset Allocation, Diversification, and Rebalancing
- Investor.gov (SEC), Redemption Fee
- Sirri and Tufano, "Costly Search and Mutual Fund Flows," Journal of Finance 53(5), 1998
- Aswath Damodaran, Historical Returns on Stocks, Bonds and Bills, 1928–2025
- Federal Reserve Bank of St. Louis, FRED: S&P 500 (SP500), accessed October 2026
- IRS, Revenue Procedure 2025-32
- IRS, IR-2025-103: tax inflation adjustments for tax year 2026
- IRS, Topic no. 409, Capital gains and losses
- IRS, Topic no. 559, Net investment income tax
- IRS, Publication 550 (2025), Investment Income and Expenses
- IRS, Publication 590-A (2025), Contributions to IRAs
- IRS, Retirement plan and IRA required minimum distributions FAQs