The usual way to explain rate hikes is a checklist — stocks do this, bonds do that, gold does the other — and it hides the one thing actually worth understanding. A hike does not act on asset classes. It acts on time. Raise the cost of money and every promise of a future dollar is worth less today, which means the only question that really decides how hard an asset falls is how far in the future its cash sits. Learn to read that single variable and the scattered list collapses into one idea: almost everything that got hurt in the last tightening was the same bet wearing different clothes. This guide is about that variable — duration — because once you see it, rate moves stop being a mystery and start being a map.
Rates Reprice One Thing
Start with the mechanism, because it is simpler than the checklists suggest. An asset is worth the present value of the cash it will throw off: add up each future payment, divide each one by (1 + the interest rate) raised to the number of years until it arrives, and you have today’s fair price. Raise that rate and every term in the sum shrinks — and the payments furthest in the future shrink the most, because they are divided by the biggest number. So when a central bank lifts its policy rate, it is not running five separate playbooks for five asset classes. It is turning one dial that reprices every future dollar in the economy at once. That is why the SEC can state it flatly — when market interest rates rise, the prices of fixed-rate bonds fall. The same discounting math sits underneath stocks, real estate, and private deals; it is just less visible there, which is exactly why it catches people out.
This is not an abstract cycle, either. The Federal Reserve raised its target range from near zero in early 2022 to 5.25–5.50% by mid-2023, and after the economy cooled it trimmed the range back to 3.50–3.75% as of mid-2026. Well below the peak, but a world away from the near-zero decade that came before — a reminder that duration is priced again, not free, and that the mechanism below matters at any level of rates, not just when they are spiking.
Duration Is the Real Axis
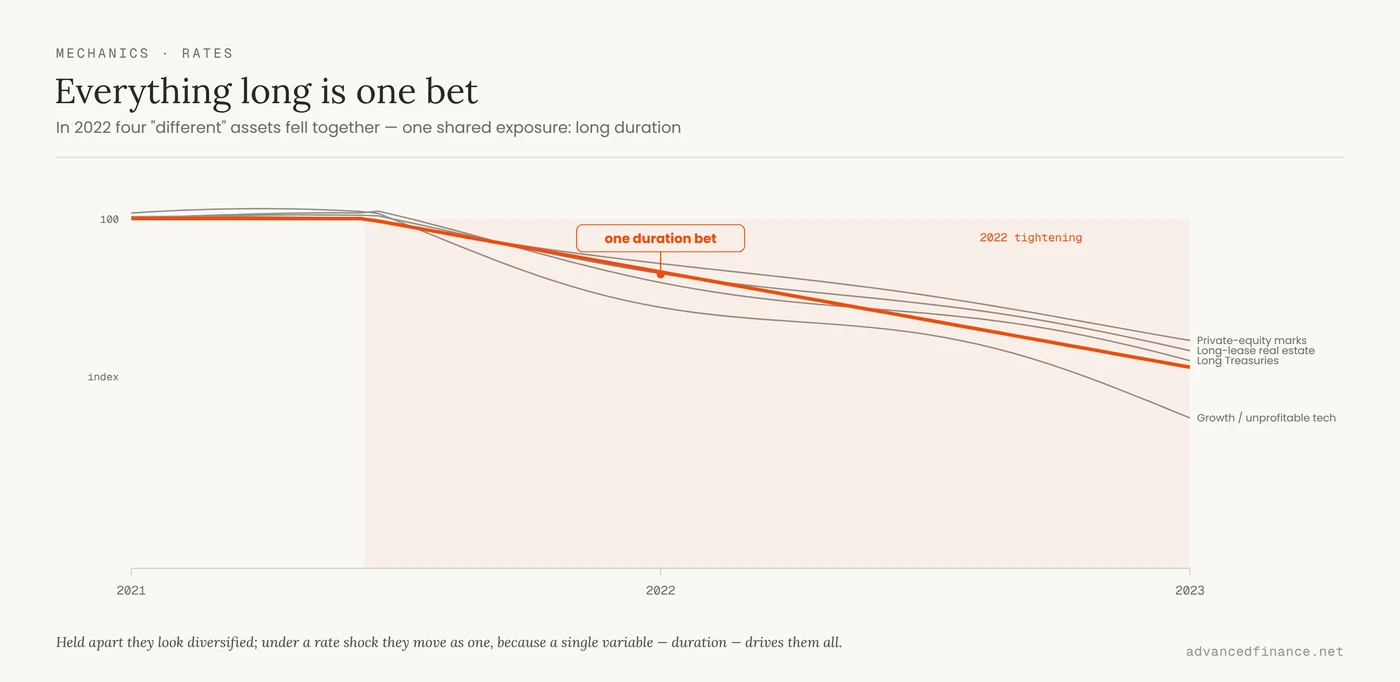
If discounting is the force, duration is the lever that decides how much it moves any given asset. Duration measures how far out an asset’s cash flows sit, and it comes with a number you can actually use: FINRA explains that a bond’s price moves by roughly its duration for each one-percentage-point change in rates — a duration of 10 implies about a 10% price drop when rates rise a point, and the longer the maturity, the higher that number. A long-dated Treasury can shed 15% or more of its price on a single point of rate rise for exactly this reason. The reframe is the whole point of this article: the market is not really divided into “stocks” and “bonds.” It is divided into short-duration and long-duration. Two assets with the same duration respond to a rate move in much the same way, no matter which asset class they happen to belong to. Once you measure holdings by when their cash arrives rather than by their label, the confusing patchwork of reactions turns into a single, orderly axis.
| Holding | Where its cash flows sit | Duration | How a hike hits it |
|---|---|---|---|
| Cash, T-bills, floating-rate credit | Now, and resets with rates | ~ Zero | Income rises — a winner |
| Short-term bonds | Near future | Low | Mild price dip |
| Value / high-cash-flow equities | Earnings mostly today | Medium | Repriced, but cushioned |
| Long Treasuries, growth & unprofitable tech, long-lease property | Far in the future | High | Hit hardest — the same bet |
Everything Long Is One Bet
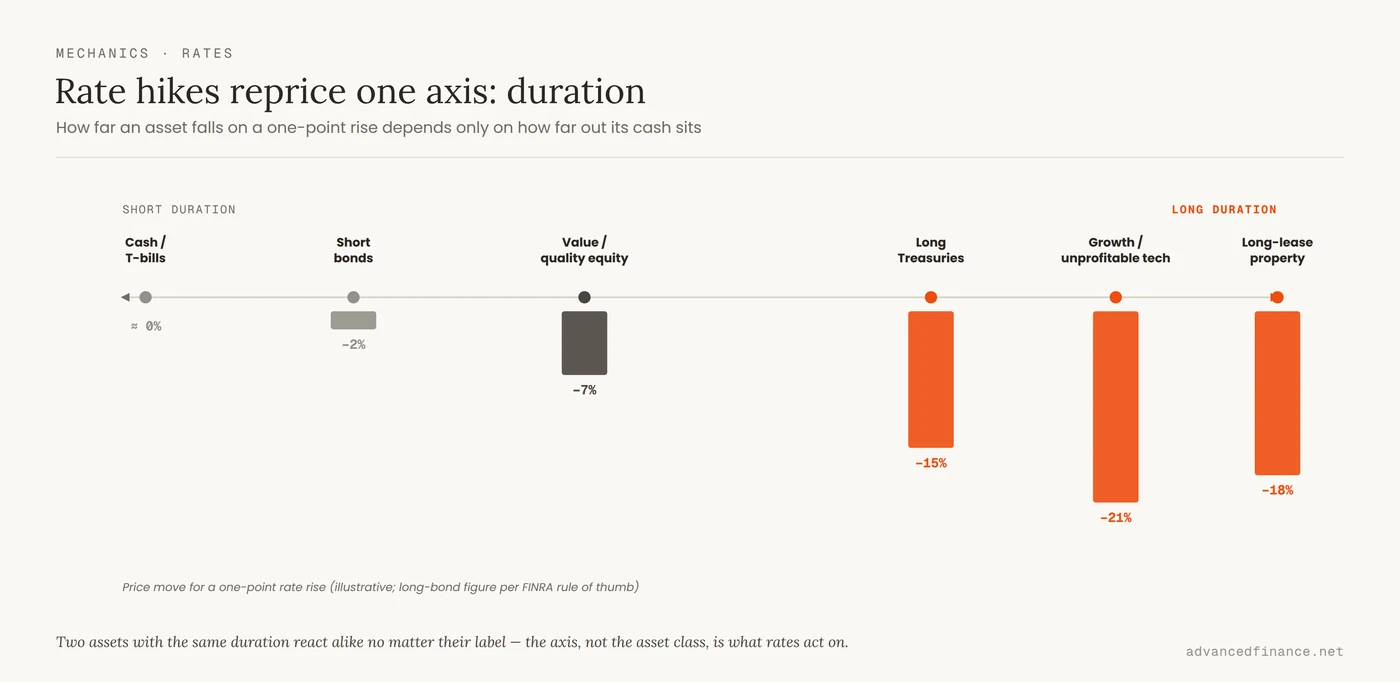
Now line up what actually got punished in the 2022 tightening: twenty-year Treasuries, unprofitable growth tech, richly valued software, long-lease commercial property, and private assets whose worth rests on a distant exit. Different tickers, different sectors, one shared exposure — long duration. That is why stocks and bonds fell together that year, an event that quietly broke the diversification the classic 60/40 portfolio depends on. It is also, seen only within the stock market, the same mechanism behind why growth stocks fall harder than value: growth and value are really the two ends of a duration bet on rates, the equity-only version of the split this whole article is about. The uncomfortable implication is that you can own ten different names and still hold a single duration bet without realizing it. The whole discipline of surviving a hiking cycle is seeing that hidden concentration before the market forces you to.
What Actually Diverges
Duration explains most of it, but not all, and the exceptions are where the opportunities hide. Some assets carry almost no duration because their cash flows reset: cash and Treasury bills start paying real income, and floating-rate private credit sees its coupon rise as rates climb, so these gain exactly where long fixed-rate bonds lose. Banks and financials often benefit outright, earning wider margins on the loans they make. Real estate splits by lease length rather than by the word “property” — a warehouse or apartment block with short, inflation-linked leases reprices rents quickly and behaves like a shorter-duration asset, while a tower locked into a twenty-year lease behaves like a long bond. And because a hike is usually a response to inflation, real assets answer to real rates — the nominal rate minus inflation — rather than the headline move; gold, for instance, often holds up when real rates stay low even as nominal rates climb, because the inflation it hedges is the very thing the central bank is fighting. The table below reads the major asset classes through that same lens.
| Asset class | Why a hike helps or hurts it | Net effect |
|---|---|---|
| Long government bonds | Long fixed cash flows — high duration | Falls hard |
| Growth & unprofitable tech | Earnings sit far in the future | Falls hard |
| Value & quality equities | Cash flows arrive sooner, less debt | Cushioned |
| Banks & financials | Earn wider margins as rates rise | Often benefit |
| Real estate | Behaves by lease length, not by label | Mixed by type |
| Commodities & gold | Answer to real rates, not nominal | Hold up if real rates stay low |
| Cash & floating-rate credit | Coupons reset upward with rates | Winner |
| Crypto & speculative growth | Long-duration risk assets with no near cash flow | Hit hard |
What people call a “quality” tilt in a high-rate world is really shorthand for the same idea — cash flows that arrive sooner and do not depend on cheap refinancing to survive.
The Lag You Can’t See
The other trap is timing. A rate hike does not deliver its full damage on the day it is announced; monetary policy takes roughly twelve to eighteen months to filter through the economy. The real harm usually lands later, when cheap debt comes due and has to be refinanced at the new, higher rate, or when an interest-rate hedge expires. A company can look perfectly healthy three months after a hike and then crack a year later as it hits its “maturity wall” — the schedule of when its borrowings must be rolled over. This is why cheap leverage is the thing to hunt for in your own holdings: a business or a fund that only works while it can borrow at yesterday’s rates is living on borrowed time as much as borrowed money. Do not confuse having survived the hike with being immune to it. The question is always when the financing has to be renewed.
How To Read Your Book
The practical shift is to stop reading your portfolio as a list of tickers and start reading it as a map of duration and financing. In practice that is a handful of habits:
- Ask where each holding’s cash flows sit. Mostly soon, or mostly far in the future? The further out, the more a rate move will push it around.
- Separate fixed from floating. Floating-rate income rises with rates; long fixed coupons fall. Knowing the mix tells you whether a hike helps or hurts you.
- Judge the spread, not the yield. A bond paying 7% when cash pays 5% offers only a two-point premium for real default risk — often not enough. Reaching for the absolute number is how yield turns into loss.
- Treat short-duration cash as a position. With bills finally paying, dry powder is a strategic holding, not a drag — and it lets you buy the long-duration assets others are forced to dump.
- Map the maturity wall. For anything you own, ask when it — or the company behind it — must refinance, and at what rate. Cheap-credit dependence is the real hidden risk.
- Use the down years. When both stocks and bonds fall at once, that is the moment to harvest the losses into a tax deduction, and to remember that a higher-for-longer regime rewards different holdings than the cheap-money decade did.
Diversifying by duration rather than by ticker count is really just the practical face of thinking about a portfolio in terms of how its parts move together — and rates are the force that makes the supposedly different parts move as one.
FAQ
Do high interest rates always lead to a stock market crash?
No. Higher rates compress valuations rather than guaranteeing a crash, and they do it unevenly — long-duration growth names take the biggest markdown, while profitable, low-debt businesses whose earnings arrive soon can hold up or even gain relative ground. It is a repricing of the future, not an automatic collapse of the present.
Is gold a good investment when rates are high?
It depends on real rates, not the headline number. Gold tends to do well when real rates — the nominal rate minus inflation — are low or negative, even if nominal rates look high, because the inflation it hedges is precisely what the hikes are fighting. When real rates rise sharply, gold usually struggles.
How do higher rates affect my mortgage and home equity?
New fixed-rate mortgages cost more, so the same house takes a bigger monthly payment, which cools home prices over time. If you locked in a low fixed rate you are largely insulated, but anything variable — an adjustable mortgage or a home-equity line — reprices upward and gets more expensive to carry.
Should I move all my money into a High-Yield Savings Account?
Cash finally pays a real return, and it is excellent dry powder, but it is short-duration by nature: you reinvest at whatever rate exists next year, and over long horizons it tends to lose to inflation. Use it as a deliberate bucket for near-term needs and opportunities, not as the whole plan.
Which sectors benefit most from rising interest rates?
The ones whose earnings rise with rates or do not lean on cheap credit: banks earning wider margins on loans, cash-rich businesses with near-term cash flow, and floating-rate lenders. The losers are predictable from the same logic — the long-duration, refinancing-dependent names whose value assumes money stays cheap.
Author’s Insight
What took me longest to learn about rate hikes had nothing to do with which assets fall — that part is visible on day one. It was the timing. The real damage in a tightening cycle almost never lands when the hike is announced; it lands a year or more later, when a company that looked perfectly healthy suddenly has to refinance its cheap debt at the new rate and the math quietly stops working. The businesses that came apart around me were not the obviously reckless ones. They were the ones built on the unspoken assumption that money would stay cheap, and they kept looking fine right up until their maturity wall arrived. So now, before I own anything, I ask one unglamorous question: when does this — or the company behind it — have to roll its financing, and at what rate? That single question has protected me more than any forecast of where the Fed is headed ever did.
Bottom Line
Rate hikes look complicated because they are usually explained as a dozen separate effects, when they are really one effect seen from a dozen angles: a higher discount rate makes future money worth less today, and the assets whose money arrives furthest out fall the hardest. Duration is the axis that organizes everything — long bonds, growth stocks, unprofitable tech, and long-lease property are one bet in different costumes, which is why they sank together in 2022. Read your portfolio by when its cash flows arrive and whether they are fixed or floating, know when each holding has to refinance, and treat cheap-credit dependence as the real risk rather than the direction of the next meeting. The level of rates will keep changing; the map does not. Learn to read your book in duration, and a rate cycle stops being something that happens to you and becomes something you can see coming.