“Big data is revolutionizing financial research” is one of the most repeated sentences in finance and one of the least useful, because it quietly assumes that the data is the thing that wins. It isn’t. The world now generates an ocean of data, and almost all of it is for sale to anyone with a budget — which is exactly why owning it, on its own, is worth so little. The firms that actually pull an edge out of this ocean are not the ones with the most data; they are the ones asking a question nobody else is asking and refining raw feeds into a decision faster than the crowd. This guide is about that gap — between data and insight — because that gap is where the entire edge lives, and where most of the money is quietly lost.
Data Is Not Insight
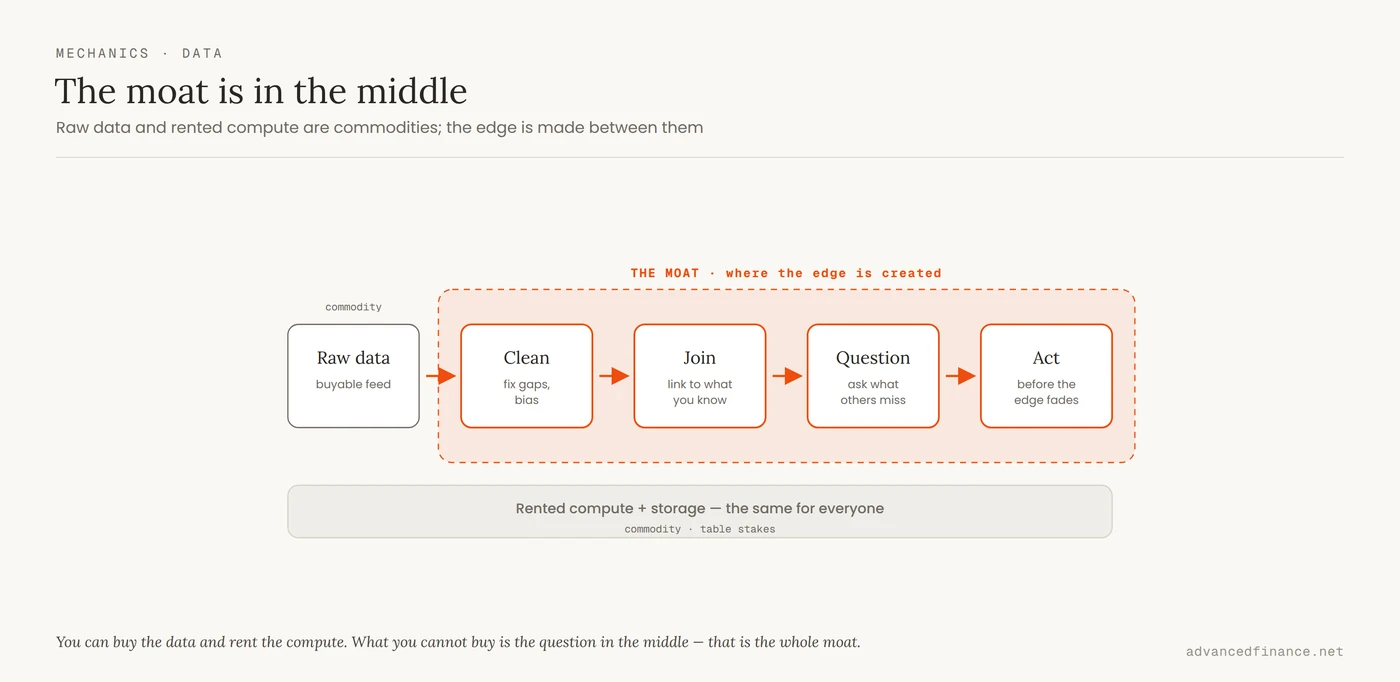
Start by killing the founding myth. If raw data were the edge, the biggest data buyers would simply win, and they demonstrably do not — some of the largest, best-funded data operations in finance post mediocre returns. Data is a raw material, like crude oil: abundant, fungible, and useless until it is refined. The satellite feed that counts cars in a retail parking lot is sold by a vendor to every fund that will pay, so the picture itself carries no advantage. What carries the advantage is the refinery around it: the specific hypothesis you point it at, the messy work of cleaning and joining it to everything else you know, and the judgment to act on the result while it still matters. Treat data as the answer and you will drown in it; treat it as raw material for a question, and it becomes worth something. The scarce resource was never the data. It was, and still is, the question.
Why a Data Edge Decays
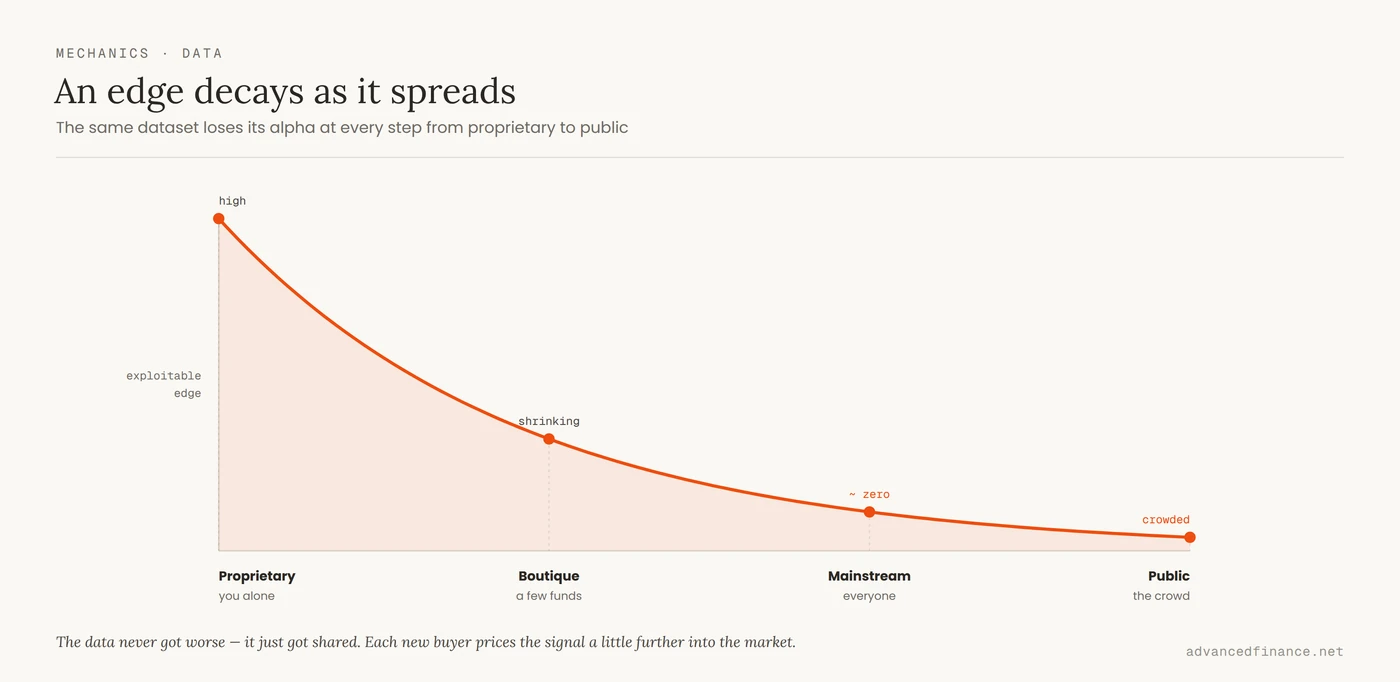
There is a hard economic reason a dataset stops paying, and it was written down decades before “alternative data” had a name. In their foundational paper, Grossman and Stiglitz proved that prices cannot fully reflect all available information, because if they did, nobody would be paid for the costly work of gathering it — and with no one gathering, prices would reflect nothing. The market only rewards you for information the price has not yet absorbed. That single idea is fatal to the “buy more data” strategy: the moment a dataset is packaged and sold widely, its signal gets traded into prices and the alpha decays toward zero. You are then paying a rising subscription to know what everyone else already knows, which is the definition of a commodity, not an edge. This is the same treadmill that drives where a durable trading edge actually comes from: an edge is only an edge while it is scarce. A data source has a half-life, and buying it later in that life means paying more for less.
| Stage | Data status | Who holds it | Edge left |
|---|---|---|---|
| Proprietary | You build or scrape it yourself | You alone | High — the signal is genuinely yours |
| Boutique | A niche vendor sells it quietly | A handful of funds | Shrinking as buyers pile in |
| Mainstream | A major terminal offers it to all | Effectively everyone | Near zero — priced in |
| Public | Free and widely discussed | The whole crowd | Negative — the trade is crowded |
It is fair to push back here, because some practitioners argue the decay is overstated. Large funds rarely trade a single feed — they blend hundreds of datasets in proprietary ways, so two desks holding the identical data can produce completely different signals, and heavily distributed data such as credit-card panels is still bought at scale. That objection is correct, but it does not rescue the dataset; it relocates the value. What persists is the combination and the interpretation — the proprietary way the feeds are joined and the question they are pointed at — not the raw feed, whose standalone edge still erodes as it spreads. It is the same pattern documented in equities, where factor premiums shrink as they become widely known and harvested. The moat was never the data. It was what you did with it.
The Satellite Lesson
The parking-lot satellite trade is the poster child of big-data finance, so it is worth knowing what actually happened when researchers studied it directly. Examining exactly this kind of imagery, Katona, Painter, Patatoukas and Zeng found that satellite coverage let sophisticated investors trade profitably ahead of retailers’ bad news, while individual investors’ buying became less informed and liquidity in those stocks deteriorated. Their conclusion is worth reading twice: unequal access to big data can increase information asymmetry among market participants without immediately improving price discovery. In plain terms, the data did not democratize anything. It tilted the field toward whoever could process it, and the losers were the participants who could not. The lesson generalizes to every shiny dataset: the edge accrues to the processing and the interpretation, and it comes at someone else’s expense. The specific feeds change, but the shape of the trade — and the way its edge leaks — does not:
| Dataset | Used to estimate | How the edge leaks |
|---|---|---|
| Satellite imagery | Retailer foot traffic, oil in storage, crop yields | Resold to many funds; priced in once widely subscribed |
| Credit-card panels | Company revenue ahead of the earnings report | Most distributed feed of all; value survives only in the blend |
| Web-scraped prices | Real-time inflation, competitor pricing | Cheap to replicate; scrapers converge on the same reading |
| Shipping / logistics | Supply-chain health, trade flows | Widely resold; the lead time shrinks as coverage grows |
Read the right-hand column and the pattern is unmistakable: none of these lose value because the data got worse. They lose value because more people bought the same thing. If you cannot tell who is on the other side of your clever data trade, and why they are slower than you, you may be the slow one.
Where the Real Moat Is
If the data is a commodity, so, increasingly, is the machinery. The SEC’s staff report on algorithmic trading describes US markets as primarily automated, with the use of algorithms “pervasive” across the trading lifecycle. Cloud warehouses and distributed compute mean a boutique can now rent the same horsepower as a Tier-1 bank by the hour — which is precisely why that horsepower is no longer a differentiator. When everyone can store petabytes and run the same models, the moat moves up the stack to the things that do not commoditize: asking a question the rest of the market has overlooked, cleaning and joining data that others abandon because it is ugly, interpreting a signal in the context of a regime, and acting before the advantage decays. Speed of reaction is part of this too, which is why so much of it now happens through algorithmic desks that react to news in microseconds. The pipeline and the judgment are the moat. The dataset and the servers are table stakes you pay just to sit at the table.
This is also the honest answer to the question every 2026 reader is asking: what about AI? Large language models now read filings, earnings-call transcripts, and news at a scale no analyst could match, and that genuinely compresses the grunt work of research. But it does not rescue data as an edge — it relocates the same problem one level up. When every desk runs a similar model over the same public filings, the signal the model extracts commoditizes exactly as the raw data did before it; a readout everyone can generate is consensus, not alpha. The durable advantage moves to the parts a shared model cannot supply: the proprietary data you feed it, the sharpness of the question you ask it, and the judgment to recognize when its confident answer is wrong. AI raises the floor for everyone, which is exactly why it is not, by itself, a moat.
The Overfitting Trap
Here is the cruel twist: more data and more compute make it easier to fool yourself, not harder. Every extra variable and every extra model you try is another chance to discover a pattern that is pure coincidence. The mathematics are unforgiving — Bailey, Borwein, López de Prado and Zhu showed that testing just ten strategy configurations on the same history is expected to produce a backtest with a Sharpe ratio of 1.57 even when the true out-of-sample performance is exactly zero. Feed a machine-learning model enough big data and it will always find something that “worked” — it mistook noise for signal, and the impressive backtest is an artifact of how many times you let it guess. The defenses are old and boring: hold back data the model never sees, correct honestly for how many configurations you tried before one succeeded, and treat any result you cannot explain economically as suspect. Skipping that discipline is a large part of why strategies that look flawless on paper collapse in live markets. Big data does not rescue you from overfitting. It hands you a bigger rope.
For the Smaller Firm
None of this means an individual or a boutique should give up — it means competing on the right axis. You will not out-spend an institution on data or infrastructure, and trying to is how small firms burn their budgets buying petabytes to feel sophisticated. But the decay logic cuts both ways: the questions large funds ignore because they are too small to move a multibillion-dollar book are exactly the questions still holding signal, and they are yours to take. A creative use of cheap, public data aimed at one narrow, well-defined question will beat an expensive dataset used without a hypothesis every time. Before paying for any dataset, force it through four questions — the answers usually cost less than the subscription:
- Distribution: how many funds already receive this exact feed? The more seats a vendor has sold, the closer its standalone edge already sits to zero.
- Point-in-time integrity: does the history record only what was knowable on each date, or is it quietly back-filled with later revisions? Look-ahead bias manufactures edges that never existed.
- Trials taken: how many variants did you test before one “worked”? Without correcting for the number of attempts, the winner is probably the noise described in the overfitting trap above.
- Net of frictions: does the expected edge survive costs, slippage, and the ongoing compute and storage to keep the model live? An edge that cannot clear its own costs is an expensive hobby.
The catch underneath all four is sample size — a pattern that shows up in a handful of cases proves nothing, and the same base-rate discipline that governs how you find a genuinely high-probability setup applies to any data-driven idea: you need a real sample before you trust the number. Focus beats firepower when the firepower is rented by everyone.
FAQ
Isn’t more data always better?
No. Beyond a point, more data mostly buys you what everyone else already has and multiplies your chances of overfitting to noise. A smaller, cleaner dataset pointed at a sharp question routinely beats a giant one used without a hypothesis. Quality of question first, quantity of data a distant second.
Can big data let a small firm compete with hedge funds?
On infrastructure, yes — cloud compute has largely leveled that. On data spending, no, and you should not try. Compete where budget does not decide the winner: on the originality of your questions and the cleanliness of your pipeline. The research on alternative data suggests raw access tends to favor whoever can process it best, not whoever buys the most.
What exactly is “alternative data”?
It is any non-traditional source — satellite imagery, credit-card transactions, web-scraped prices, shipping manifests, app usage — used to estimate a company’s health before official reports. It can be powerful, but its edge decays as more buyers subscribe, so the value is in getting there early and interpreting it well, not in owning it.
Does AI change the answer?
It changes the workload, not the logic. Language models read filings and transcripts faster than any team, but once everyone runs a similar model over the same public documents, the output becomes consensus rather than edge. AI lifts the baseline for all participants, so the advantage returns to proprietary inputs, better questions, and human judgment about when the model is wrong.
Can big data predict a market crash?
Not reliably. Models can flag that a regime has probably shifted, usually with a lag, but crashes are rare events, and rare events are precisely where overfitting does its worst damage — a model tuned to “predict” the last crash usually just memorized it. Treat any confident crash-prediction claim as a marketing red flag.
Author’s Insight
I have watched more than one firm buy an expensive, exotic dataset mainly to feel modern, wire it into a dashboard, and then quietly drown in it — more screens, more signals, no more clarity. The teams that actually got something out of big data did the unglamorous opposite. They picked a single, specific pain point, wrote down the exact question they wanted answered, spent most of their effort cleaning and sanity-checking the inputs, and treated every promising backtest as guilty until proven innocent. Not one of their edges came from the size of the dataset. They came from asking something the rest of the market had not bothered to ask, and from the discipline to throw away the answers that were too pretty to be real. Data was never the moat. The question was.
Bottom Line
Big data changed the raw materials of financial research, not the source of the edge. The data is a commodity, the compute is rented, the models are shared — and any signal you can buy decays the moment enough other people buy it too, exactly as Grossman and Stiglitz predicted. What does not commoditize is the question you ask, the pipeline that turns ugly inputs into a clean answer, and the skepticism that keeps you from trading your own overfit noise. Stop asking how to get more data and start asking what specific thing you want to know, whether your sample is large enough to believe, and whether you can act on it before the edge is gone. In a market awash in information, the scarce resource is judgment — and judgment was never for sale.