
The usual way to frame growth versus value is as a contest between two kinds of company: the fast-expanding disruptor against the cheap, steady cash machine. Pick the right camp for the moment, the story goes, and you win. The honest version is less flattering to stock-pickers. For most of the last fifteen years, whether growth or value won had far less to do with the companies than with a single number: the long-term interest rate. Growth and value are not really styles. They are, to a first approximation, the equity-market face of a broader force — a rate move reprices every asset by how far in the future its cash arrives — and within stocks that force resolves into the two ends of a single duration bet. Once you see that, “which one wins in volatile markets” stops being a mystery and becomes a much sharper question — where are rates heading, and are you being paid to guess?
The Bet Hiding in the Label
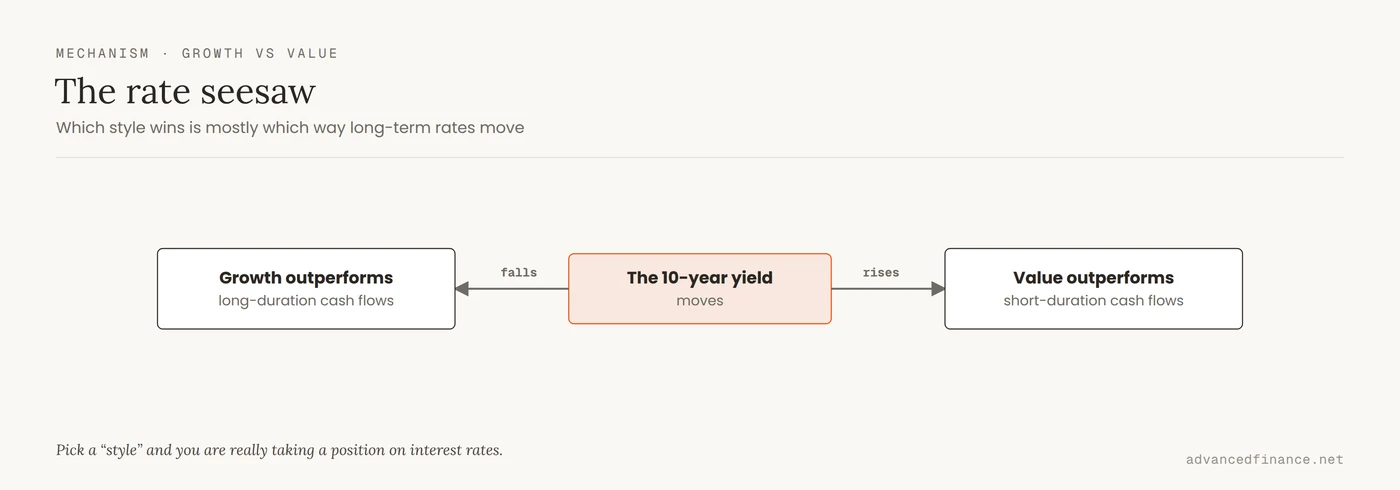
Start with what a stock actually is. A share price is nothing more than the discounted value of the cash a company will produce in the future. The word doing the heavy lifting there is discounted: a dollar of profit arriving ten years from now is worth less today than a dollar arriving next quarter, and how much less depends on the discount rate — which tracks the 10-year Treasury yield. Growth companies promise most of their cash far in the future. Value companies hand it over now, as earnings and dividends. That single difference drives most of the swing between the two, and it means the “style” you choose is really a position on interest rates wearing a costume.
The Two Ends of the Duration Bet
Growth: the long-duration side
A growth stock behaves like a long-dated bond. Because its value sits mostly in profits years away, a small change in the discount rate moves its price a lot — the same math that makes a 30-year bond swing more than a 2-year one. Put rough numbers on it: $100 of profit arriving in year ten is worth about $82 today at a 2% discount rate, but only about $61 at 5% — a 25% haircut from the rate change alone. Do the same for $100 arriving next year and it barely moves, from about $98 to $95. Growth is the year-ten cash flow; value is the year-one cash flow. When the 10-year yield sat near zero in 2020 and 2021, those distant cash flows were barely discounted at all, and growth multiples went vertical. That was not vindication of the business models; it was cheap money flattering long-duration assets. Growth versus value is only the equity slice of a bigger board, and seeing how a rate shock ripples through asset classes explains far more about growth’s ride than any earnings call.
Value: the short-duration side
Value sits at the other end. Its cash arrives soon, its multiples are low, and it often pays you to wait through dividends — so a rising discount rate barely dents it. That makes value the short-duration, rate-resistant side of the same trade. The catch is that cheap is not the same as good: a stock can be cheap because the business is quietly dying, the classic value trap. Value is a real and documented edge over the very long run, but it is also a fickle one — the same lesson that runs through value as a documented but unreliable factor. You are being paid a premium for discomfort, not handed a guarantee.
Laid side by side, the two “styles” are really one dial — duration — set to opposite ends:
| Growth | Value | |
|---|---|---|
| Where the cash flows are | Mostly far in the future | Mostly near term |
| Effective duration | Long | Short |
| When rates rise | Falls hard | Holds up |
| Thrived in | The 2010s zero-rate era | Rate hikes & higher-for-longer |
| Typical sectors | Mega-cap tech, software | Banks, energy, staples |
| What you are really betting | Rates keep falling | Rates stay high or rise |
What 2022 Actually Proved
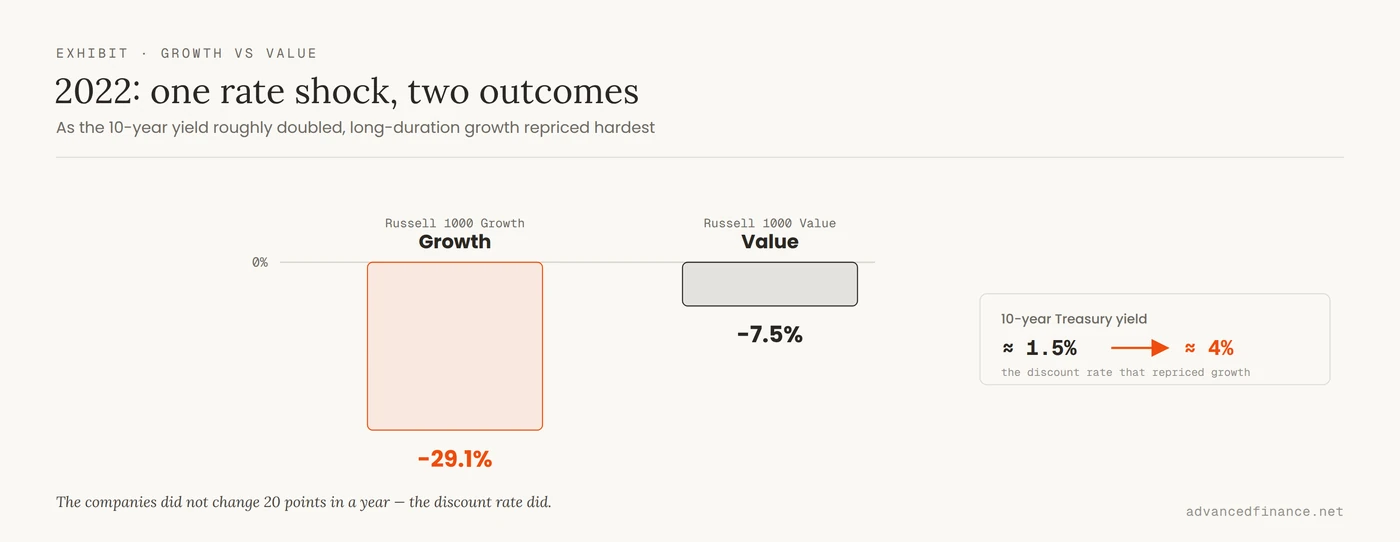
2022 was as close to a controlled experiment as markets ever give you. Over twelve months the 10-year yield roughly doubled — from about 1.5% at the start of 2022 to nearly 4% by year-end — as the Fed fought inflation, and the two styles split violently: by the Russell 1000 style indexes, value fell about 7.5% while its growth counterpart lost roughly 29% — a gap of more than twenty percentage points in a single year. The underlying companies did not become 20 points better or worse over those twelve months. The discount rate changed, and long-duration assets repriced. That is the mechanism in the open — the cleanest case, though, as the next section shows, not the only story.
Volatility Is Usually a Rate Shock
Here is why the classic question is poorly posed. “Which wins in volatile markets” assumes volatility is one thing. It is not. The volatility that flips the growth/value ranking is most often a repricing of rates and inflation expectations — and that kind of shock hits long-duration growth hardest, handing the round to value. But not every storm is a rate storm: in a pure growth scare or a flight to safety, investors sometimes crowd into mega-cap quality names that happen to be classified as growth, and the pattern inverts. So the useful question is not “growth or value?” but “is this a rate shock or a risk-off scare?” The answer usually rhymes with how sectors rotate with the economic cycle.
Where the Model Breaks Down
A framework this tidy should make you suspicious, and rightly. The rate lens is the biggest systematic lever on the growth/value ranking, but it is not the only one, and two forces regularly override it. Across the last few decades it fits roughly half the time:
| Period | 10-year rates | Style that led | Rate lens holds? |
|---|---|---|---|
| Dot-com bust, 2000–02 | Falling | Value | No — a growth bubble unwound on its own |
| ZIRP decade, 2010–20 | Near zero | Growth | Yes |
| 2022 | Spiked | Value | Yes |
| 2023–24 | High, volatile | Growth | No — an AI mega-cap boom |
The exceptions are the instructive part. In 2023 the 10-year climbed toward 5% and growth still returned roughly 43% against value’s roughly 11%, because a handful of AI-driven mega-caps rallied on their own story — proof that a concentrated boom can swamp the rate signal. In the dot-com unwind, falling rates could not save growth from a valuation bubble bursting. Two refinements make the lens more honest. First, the driver is better described as real, inflation-adjusted rates and the inflation regime than the nominal yield alone — the same nominal move means different things depending on inflation. Second, some managers, notably GMO, argue that constant index rebalancing keeps the effective durations of growth and value far closer than a textbook calculation implies, so the “duration gap” is smaller and less reliable than it looks. Hold the thesis as a strong tendency, not a law.
How to Hold Both Sanely
All of this tempts you toward a single, dangerous move: predict the next turn in rates and bet the portfolio on it. Resist. Rate turns humble everyone, the Fed included, and the 2010s taught a decade of value investors that “rates have to normalize” can be wrong for far longer than you can stay solvent. Today the 10-year sits near its highest in years, and a genuine higher-for-longer regime would structurally favor value — but “would” is not “will,” and turning that view into a concentrated bet is exactly the switching that quietly costs most investors their returns. Conviction about the mechanism is not the same as knowing the timing.
The workable response is unglamorous. Own both ends of the duration spectrum on purpose, and rebalance on a rule so you are trimming whichever side just ran — the discipline that quietly buys low and sells high. Concretely, the value side is funds like VTV or IWD and the growth side VUG or IWF, while a plain total-market index already holds both. Know your net exposure: gauge how much of your equity sits in high-multiple, no-dividend growth versus cash-generative value — the heavier the growth tilt, the longer your book’s effective duration, and the more a jump in rates will sting. The same rate sensitivity already lives inside the bond side of a 60/40 portfolio. If you want a tilt, size it so a wrong call on rates bruises you rather than breaks you. The investors who do well here are not the ones who called the pivot; they are the ones who never needed to.
FAQ
Is value always better when rates rise?
Usually, but it is a tendency, not a law. Rising discount rates hurt long-duration growth more, which is why value tends to win those stretches. The big exceptions are a risk-off panic where investors treat a few mega-cap “growth” giants as safe havens, and a concentrated boom like 2023’s AI rally, where growth won despite high rates.
Is it really rates, or is it inflation?
Inflation is the deeper driver; rates are how it shows up in prices. It is the change in real, inflation-adjusted rates — and the inflation regime around it — that moves the discount rate and repriced growth in 2022. Watching the nominal 10-year is a useful shorthand, not the whole mechanism.
Isn’t this just factor investing?
It is related but not the same. Factor investing is about harvesting a long-run premium from cheapness itself. This lens is narrower and more mechanical: it explains the short- and medium-term swings between styles as a bet on the direction of interest rates.
How do I tell my portfolio’s rate exposure?
Look at your growth-versus-value split. The more you lean toward high-multiple, far-future-cash-flow growth names (or growth funds like VUG/IWF), the longer your portfolio’s effective duration, and the more a jump in the 10-year yield will hurt. A value or dividend tilt shortens that duration.
Does the VIX tell me which style to hold?
Not cleanly. A high VIX signals fear, but not its cause, and the cause is what matters. Rate-driven fear favors value; a pure growth-scare or liquidity flight can favor mega-cap growth. The VIX is a thermometer, not a diagnosis.
Author's Insight
The most useful thing I ever did with the growth-versus-value debate was to stop treating it as a stock-picking question and start treating it as a rates question. Once I mapped my equity book by duration rather than by style label, my portfolio stopped surprising me: the “growth” drawdowns in rate-hiking years were not a failure of the companies, they were exactly what a long-duration position does when the discount rate rises. I hold both sides now, not because I am indifferent, but because I have watched too many confident people — myself included — get the timing of rates wrong, and I have watched years like 2023 ignore the rulebook entirely. The tilt I keep is small enough that being wrong is a cost, not a catastrophe. That is the whole discipline.
Bottom Line
Growth versus value is not mainly a referendum on which companies are better; it is largely a bet on the direction of long-term interest rates, dressed as a style choice. Growth is the long-duration side that soars when rates fall and buckles when they rise; value is the short-duration side that holds up when they do. 2022 showed the mechanism cleanly, 2023 showed its limits, and the deeper driver is real rates and inflation, not the nominal yield alone. Since you cannot reliably time the rate cycle, the sane move is to own both, rebalance on a rule, know how much of a rate bet your portfolio is quietly making, and keep any tilt small enough to survive being wrong.